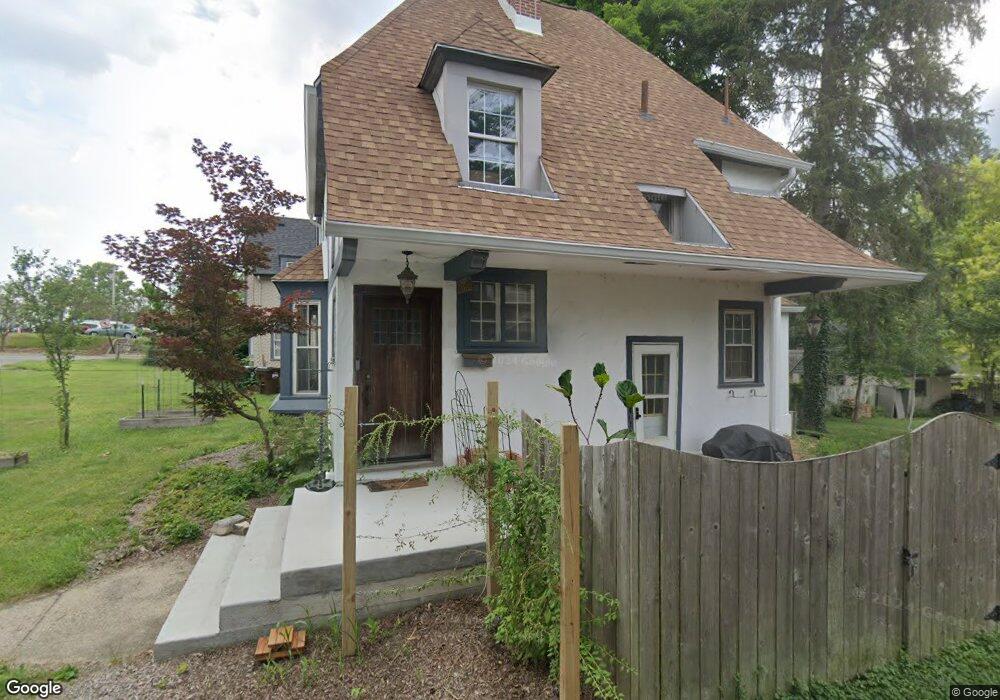
1589 Glenbeck Ave Dayton, OH 45409
Estimated Value: $240,000 - $255,000
4
Beds
1
Bath
1,669
Sq Ft
$149/Sq Ft
Est. Value
About This Home
This home is located at 1589 Glenbeck Ave, Dayton, OH 45409 and is currently estimated at $248,315, approximately $148 per square foot. 1589 Glenbeck Ave is a home located in Montgomery County with nearby schools including Southdale Elementary School, Van Buren Middle School, and Kettering Fairmont High School.
Ownership History
Date
Name
Owned For
Owner Type
Purchase Details
Closed on
Jul 28, 2022
Sold by
Straight Antonio F
Bought by
Straight Family Investments Llc
Current Estimated Value
Purchase Details
Closed on
Sep 28, 2010
Sold by
Straight Jennifer J and Wright Jennifer J
Bought by
Straight Antonio F
Home Financials for this Owner
Home Financials are based on the most recent Mortgage that was taken out on this home.
Original Mortgage
$140,582
Interest Rate
4.26%
Mortgage Type
VA
Purchase Details
Closed on
Aug 31, 2005
Sold by
Koon Keith A and Faber Jamie S
Bought by
Straight Antonio F and Straight Jennifer J
Home Financials for this Owner
Home Financials are based on the most recent Mortgage that was taken out on this home.
Original Mortgage
$147,450
Interest Rate
5.89%
Mortgage Type
VA
Purchase Details
Closed on
Jun 13, 1999
Sold by
Faber Jamie S and Kindell Jamie S
Bought by
Faber Jamie S and Koon Keith A
Create a Home Valuation Report for This Property
The Home Valuation Report is an in-depth analysis detailing your home's value as well as a comparison with similar homes in the area
Home Values in the Area
Average Home Value in this Area
Purchase History
| Date | Buyer | Sale Price | Title Company |
|---|---|---|---|
| Straight Family Investments Llc | -- | None Listed On Document | |
| Straight Antonio F | -- | Attorney | |
| Straight Antonio F | $144,000 | -- | |
| Faber Jamie S | -- | -- |
Source: Public Records
Mortgage History
| Date | Status | Borrower | Loan Amount |
|---|---|---|---|
| Previous Owner | Straight Antonio F | $140,582 | |
| Previous Owner | Straight Antonio F | $147,450 |
Source: Public Records
Tax History Compared to Growth
Tax History
| Year | Tax Paid | Tax Assessment Tax Assessment Total Assessment is a certain percentage of the fair market value that is determined by local assessors to be the total taxable value of land and additions on the property. | Land | Improvement |
|---|---|---|---|---|
| 2024 | $4,093 | $65,830 | $17,080 | $48,750 |
| 2023 | $4,093 | $65,830 | $17,080 | $48,750 |
| 2022 | $3,696 | $46,970 | $12,200 | $34,770 |
| 2021 | $3,419 | $46,970 | $12,200 | $34,770 |
| 2020 | $3,430 | $46,970 | $12,200 | $34,770 |
| 2019 | $3,566 | $43,200 | $11,620 | $31,580 |
| 2018 | $3,585 | $43,200 | $11,620 | $31,580 |
| 2017 | $3,302 | $43,200 | $11,620 | $31,580 |
| 2016 | $3,462 | $42,580 | $11,620 | $30,960 |
| 2015 | $3,308 | $42,580 | $11,620 | $30,960 |
| 2014 | $3,308 | $42,580 | $11,620 | $30,960 |
| 2012 | -- | $45,490 | $11,170 | $34,320 |
Source: Public Records
Map
Nearby Homes
- 1597 Old Lane Ave
- 1536 Old Lane Ave
- 2467 S Dixie Dr
- 1473 Constance Ave Unit 1481
- 1545 Cardington Rd
- 1554 Crescent Blvd
- 1420 Adirondack Trail
- 1615 Carrollton Ave
- 2230 S Patterson Blvd
- 1424 Elmdale Dr
- 1364 Elmdale Dr
- 1129 W Dorothy Ln
- 3225 Southdale Dr Unit 1
- 3060 Regent St
- 1211 Runnymede Rd
- 1160 Waving Willow Dr
- 1151 Brookview Ave
- 1314 Ridgeview Ave
- 447 Kramer Rd
- 1125 Laurelwood Rd
- 1597 Glenbeck Ave
- 1581 Glenbeck Ave
- 1573 Glenbeck Ave
- 1565 Glenbeck Ave
- 1596 Stockton Ave
- 1580 Stockton Ave
- 1557 Glenbeck Ave
- 1572 Stockton Ave
- 1588 Glenbeck Ave Unit A
- 1588 Glenbeck Ave
- 1564 Stockton Ave
- 1549 Glenbeck Ave
- 1580 Glenbeck Ave Unit 3
- 1580 Glenbeck Ave
- 1572 Glenbeck Ave
- 1556 Glenbeck Ave
- 1556 Stockton Ave
- 1541 Glenbeck Ave
- 1548 Glenbeck Ave
- 1548 Stockton Ave