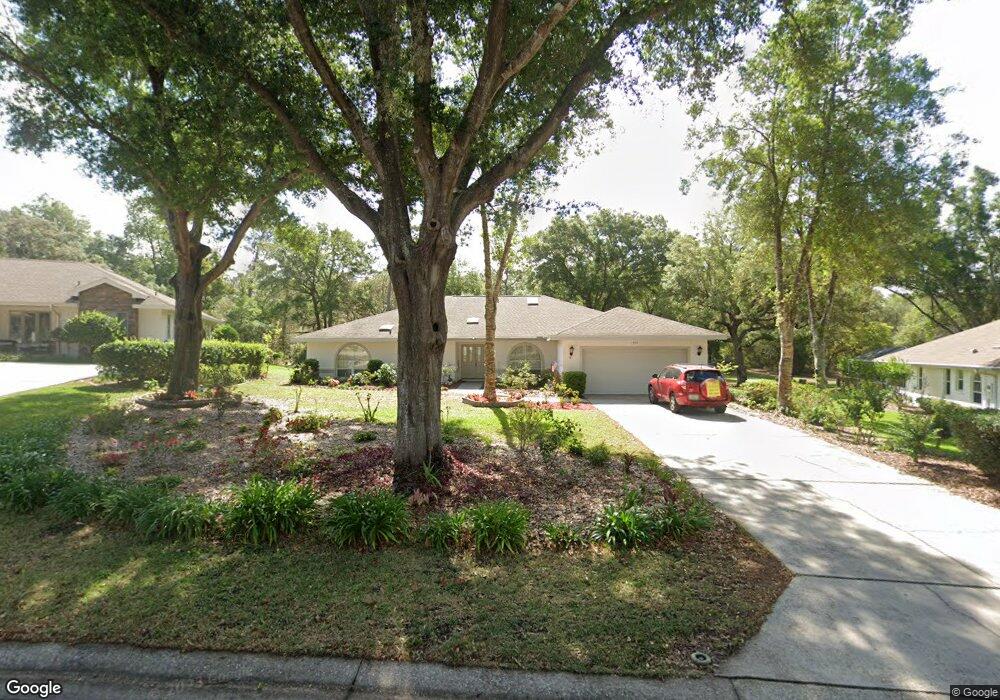
1589 N Marlborough Loop Crystal River, FL 34429
Estimated Value: $316,000 - $363,000
3
Beds
2
Baths
2,360
Sq Ft
$142/Sq Ft
Est. Value
About This Home
This home is located at 1589 N Marlborough Loop, Crystal River, FL 34429 and is currently estimated at $335,359, approximately $142 per square foot. 1589 N Marlborough Loop is a home located in Citrus County with nearby schools including Rock Crusher Elementary School, Crystal River High School, and Crystal River Middle School.
Ownership History
Date
Name
Owned For
Owner Type
Purchase Details
Closed on
Sep 26, 2017
Sold by
Anderson Neville E and Anderson Neville Emmett
Bought by
Revoca Anderson Neville Emmett and Revoca Neville Emmett Anderson
Current Estimated Value
Purchase Details
Closed on
May 11, 2011
Sold by
Estrada Joseph C
Bought by
Anderson Neville E
Home Financials for this Owner
Home Financials are based on the most recent Mortgage that was taken out on this home.
Original Mortgage
$90,000
Outstanding Balance
$62,459
Interest Rate
4.85%
Mortgage Type
New Conventional
Estimated Equity
$272,900
Purchase Details
Closed on
Dec 11, 2008
Sold by
Estrada Joseph C and Estrada Lisa
Bought by
Estrada Joseph C and Joseph C Estrada Living Trust
Purchase Details
Closed on
Dec 1, 2008
Bought by
Anderson Neville E
Purchase Details
Closed on
Sep 1, 1993
Bought by
Anderson Neville E
Purchase Details
Closed on
Nov 1, 1991
Bought by
Anderson Neville E
Create a Home Valuation Report for This Property
The Home Valuation Report is an in-depth analysis detailing your home's value as well as a comparison with similar homes in the area
Home Values in the Area
Average Home Value in this Area
Purchase History
| Date | Buyer | Sale Price | Title Company |
|---|---|---|---|
| Revoca Anderson Neville Emmett | -- | Attorney | |
| Anderson Neville E | $125,000 | Express Title Services Of Ci | |
| Estrada Joseph C | -- | Attorney | |
| Anderson Neville E | $100 | -- | |
| Anderson Neville E | $100 | -- | |
| Anderson Neville E | $36,000 | -- |
Source: Public Records
Mortgage History
| Date | Status | Borrower | Loan Amount |
|---|---|---|---|
| Open | Anderson Neville E | $90,000 |
Source: Public Records
Tax History Compared to Growth
Tax History
| Year | Tax Paid | Tax Assessment Tax Assessment Total Assessment is a certain percentage of the fair market value that is determined by local assessors to be the total taxable value of land and additions on the property. | Land | Improvement |
|---|---|---|---|---|
| 2024 | $1,554 | $138,289 | -- | -- |
| 2023 | $1,554 | $134,261 | $0 | $0 |
| 2022 | $1,406 | $127,069 | $0 | $0 |
| 2021 | $1,398 | $123,368 | $0 | $0 |
| 2020 | $1,294 | $162,329 | $9,670 | $152,659 |
| 2019 | $1,273 | $162,212 | $9,670 | $152,542 |
| 2018 | $1,244 | $132,062 | $9,500 | $122,562 |
| 2017 | $1,235 | $114,311 | $13,260 | $101,051 |
| 2016 | $1,246 | $111,960 | $13,260 | $98,700 |
| 2015 | $1,260 | $111,182 | $13,270 | $97,912 |
| 2014 | $1,283 | $110,300 | $13,485 | $96,815 |
Source: Public Records
Map
Nearby Homes
- 1612 N Marlborough Loop
- 1508 N Marlborough Loop
- 1708 N Marlborough Loop
- 1445 N Chapelcross Loop
- 1491 N Chapelcross Loop
- 1366 N Merlin Terrace
- 5941 W Dedham Trail
- 1741 N Ensign Point
- 5961 W Douneray Loop
- 1581 N Endicott Point
- 1663 N Foxboro Loop
- 1435 N Endicott Point
- 1385 N Hunterston Point
- 6084 W Fairhaven Ct
- W W Norvell Bryant Hwy
- 1602 N Foxboro Loop
- 5881 W Gulf To Lake Hwy
- 5656 W Gulf To Lake Hwy
- 6258 W Lexington Dr
- 5809 W Costa Mesa Ln
- 1579 N Marlborough Loop
- 1599 N Marlborough Loop
- 1605 N Marlborough Loop
- 1567 N Marlborough Loop
- 1594 N Marlborough Loop
- 1578 N Marlborough Loop
- 1621 N Marlborough Loop
- 1564 N Marlborough Loop
- 1635 N Marlborough Loop
- 1550 N Marlborough Loop
- 1630 N Marlborough Loop
- 1607 N Bath Rd
- 1591 N Bath Rd
- 1545 N Marlborough Loop
- 1655 N Wembley Dr
- 1621 N Bath Rd
- 1530 N Marlborough Loop
- 1575 N Bath Rd
- 1650 N Marlborough Loop
- 1675 N Wembley Dr