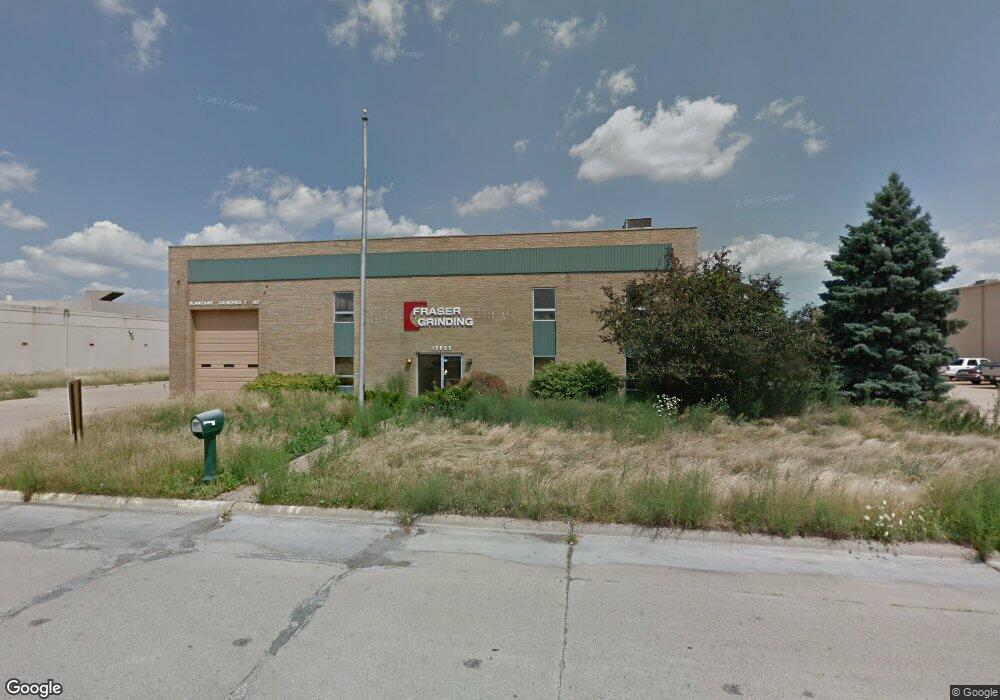
15895 Sturgeon St Roseville, MI 48066
Estimated Value: $1,219,492
--
Bed
--
Bath
15,076
Sq Ft
$81/Sq Ft
Est. Value
About This Home
This home is located at 15895 Sturgeon St, Roseville, MI 48066 and is currently estimated at $1,219,492, approximately $80 per square foot. 15895 Sturgeon St is a home located in Macomb County with nearby schools including Fountain Elementary School, Eastland Middle School, and Roseville High School.
Ownership History
Date
Name
Owned For
Owner Type
Purchase Details
Closed on
Nov 30, 2018
Sold by
Pizzo Investment Llc
Bought by
Smt Services Llc
Current Estimated Value
Home Financials for this Owner
Home Financials are based on the most recent Mortgage that was taken out on this home.
Original Mortgage
$487,500
Outstanding Balance
$429,498
Interest Rate
4.8%
Mortgage Type
Future Advance Clause Open End Mortgage
Estimated Equity
$789,994
Purchase Details
Closed on
Aug 11, 2016
Sold by
Noras Development Llc
Bought by
Pizzo Investment Llc
Purchase Details
Closed on
Dec 17, 2014
Sold by
Talmer Bank & Trust
Bought by
Noras Development Llc
Purchase Details
Closed on
Mar 14, 2014
Sold by
Geraldine Lee P and Geraldine T P
Bought by
Talmer Bank And Trust
Create a Home Valuation Report for This Property
The Home Valuation Report is an in-depth analysis detailing your home's value as well as a comparison with similar homes in the area
Home Values in the Area
Average Home Value in this Area
Purchase History
| Date | Buyer | Sale Price | Title Company |
|---|---|---|---|
| Smt Services Llc | $675,000 | None Available | |
| Pizzo Investment Llc | $480,000 | First American Title Insuran | |
| Noras Development Llc | $235,000 | Attorneys Title Agency Llc | |
| Talmer Bank And Trust | $229,500 | None Available |
Source: Public Records
Mortgage History
| Date | Status | Borrower | Loan Amount |
|---|---|---|---|
| Open | Smt Services Llc | $487,500 |
Source: Public Records
Tax History Compared to Growth
Tax History
| Year | Tax Paid | Tax Assessment Tax Assessment Total Assessment is a certain percentage of the fair market value that is determined by local assessors to be the total taxable value of land and additions on the property. | Land | Improvement |
|---|---|---|---|---|
| 2025 | $24,590 | $348,600 | $0 | $0 |
| 2024 | $11,684 | $344,300 | $0 | $0 |
| 2023 | $11,187 | $311,000 | $0 | $0 |
| 2022 | $20,011 | $298,300 | $0 | $0 |
| 2021 | $22,136 | $282,500 | $0 | $0 |
| 2020 | $10,725 | $259,800 | $0 | $0 |
| 2019 | $17,452 | $245,200 | $0 | $0 |
| 2018 | $16,515 | $229,703 | $0 | $0 |
| 2017 | $15,124 | $195,036 | $35,702 | $159,334 |
| 2016 | $11,698 | $195,036 | $0 | $0 |
| 2015 | $6,875 | $168,886 | $0 | $0 |
| 2013 | -- | $161,611 | $0 | $0 |
| 2011 | -- | $188,016 | $0 | $0 |
Source: Public Records
Map
Nearby Homes
- 15797 Common Rd
- 15867 Loreto St
- 15457 Everly St
- 15225 Common Rd
- 29152 W Brittany Ct
- 29201 Hayes Rd Unit G8
- 29294 E Brittany Ct Unit 39
- 16067 Secretariat Ave
- 16804 E 12 Mile Rd
- 16488 Benmar Ct
- 15102 Raphael Terrace Unit K67
- 29273 Rd
- 28633 Citation Dr
- 15469 Grovedale St
- 29448 El Dorado Plaza
- 29101 Hayes Rd
- 29249 Hayes #74 Rd Unit 74
- 30464 Hayes Rd
- 17350 E Pointe Dr
- 29304 Gloede Dr Unit 4
- 15970 Common Rd
- 15780 Common Rd
- 0000 Eastland St
- 00000 Eastland St
- 15929 Common Rd
- 15937 Common Rd
- 15921 Common Rd
- 15945 Common Rd
- 15909 Common Rd
- 15953 Common Rd
- 15851 Common Rd
- 15961 Common Rd
- 15839 Common Rd
- 15975 Common Rd
- 15827 Common Rd
- 15989 Common Rd
- 15815 Common Rd
- 16015 Common Rd
- 15936 Loreto St
- 15948 Loreto St