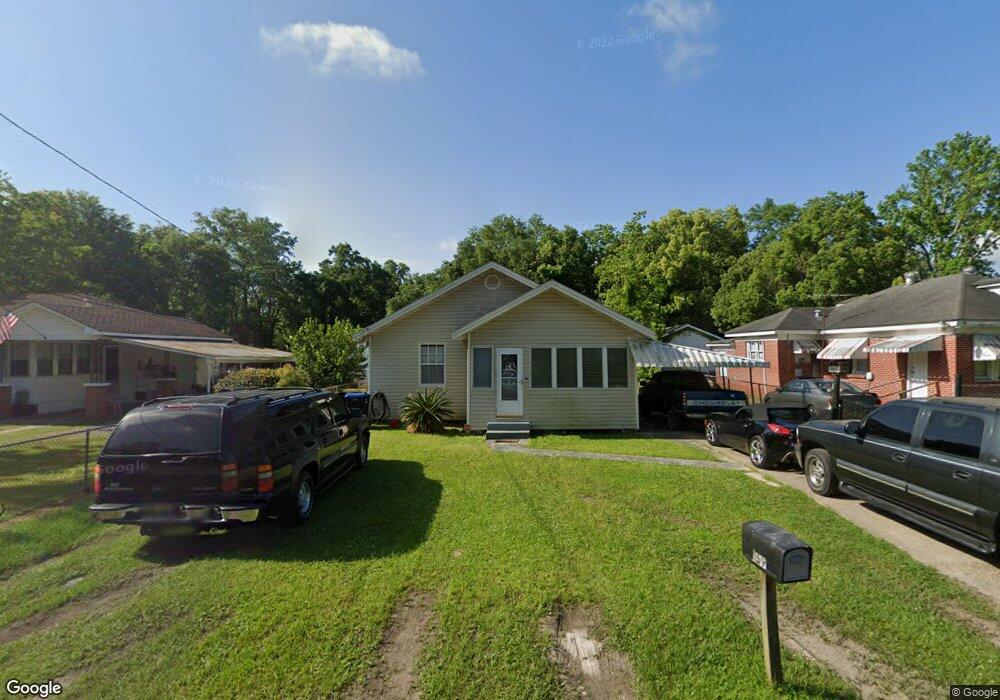
159 10th Ave Mobile, AL 36611
Estimated Value: $56,557 - $88,000
2
Beds
1
Bath
1,176
Sq Ft
$64/Sq Ft
Est. Value
About This Home
This home is located at 159 10th Ave, Mobile, AL 36611 and is currently estimated at $75,139, approximately $63 per square foot. 159 10th Ave is a home located in Mobile County with nearby schools including Chickasaw City Elementary School, Chickasaw City High School, and Prichard Preparatory School.
Ownership History
Date
Name
Owned For
Owner Type
Purchase Details
Closed on
Aug 1, 2025
Sold by
Sanderson William B and Sanderson Sherri D
Bought by
Sanderson William Chase and Sanderson Kristen N
Current Estimated Value
Purchase Details
Closed on
Jul 31, 2014
Sold by
Blakely Glenn Dennis and Blakely Sondra L
Bought by
Sanderson William B and Sanderson Sherri D
Purchase Details
Closed on
Feb 12, 1999
Sold by
Mcgahagin James Reese
Bought by
Blakely Glenn Dennis and Blakely Sondra L
Home Financials for this Owner
Home Financials are based on the most recent Mortgage that was taken out on this home.
Original Mortgage
$37,150
Interest Rate
6.79%
Mortgage Type
FHA
Create a Home Valuation Report for This Property
The Home Valuation Report is an in-depth analysis detailing your home's value as well as a comparison with similar homes in the area
Home Values in the Area
Average Home Value in this Area
Purchase History
| Date | Buyer | Sale Price | Title Company |
|---|---|---|---|
| Sanderson William Chase | $90,500 | None Listed On Document | |
| Sanderson William B | $17,500 | None Available | |
| Blakely Glenn Dennis | -- | -- |
Source: Public Records
Mortgage History
| Date | Status | Borrower | Loan Amount |
|---|---|---|---|
| Previous Owner | Blakely Glenn Dennis | $37,150 |
Source: Public Records
Tax History
| Year | Tax Paid | Tax Assessment Tax Assessment Total Assessment is a certain percentage of the fair market value that is determined by local assessors to be the total taxable value of land and additions on the property. | Land | Improvement |
|---|---|---|---|---|
| 2025 | $489 | $8,500 | $1,200 | $7,300 |
| 2024 | $489 | $7,940 | $1,200 | $6,740 |
| 2023 | $384 | $7,180 | $1,200 | $5,980 |
| 2022 | $357 | $6,680 | $1,200 | $5,480 |
| 2021 | $330 | $6,160 | $1,100 | $5,060 |
| 2020 | $330 | $6,160 | $1,100 | $5,060 |
| 2019 | $302 | $5,640 | $1,120 | $4,520 |
| 2018 | $297 | $5,560 | $0 | $0 |
| 2017 | $295 | $5,560 | $0 | $0 |
| 2016 | $451 | $8,500 | $0 | $0 |
| 2013 | $195 | $4,620 | $0 | $0 |
Source: Public Records
Map
Nearby Homes