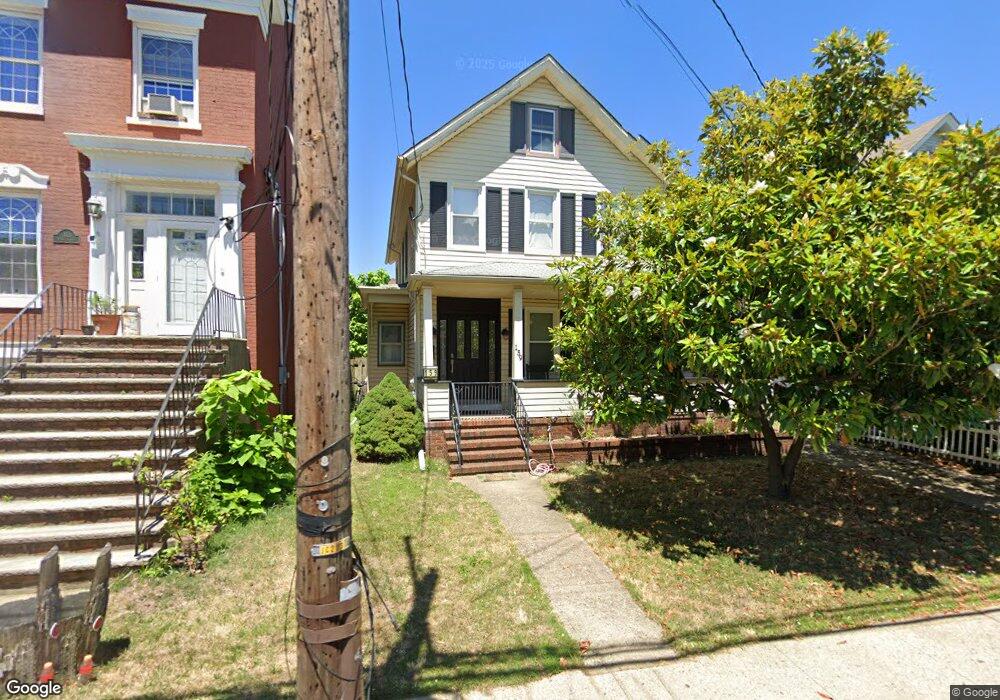
159 1st St Keyport, NJ 07735
Estimated Value: $628,000 - $673,000
3
Beds
1
Bath
1,824
Sq Ft
$357/Sq Ft
Est. Value
About This Home
This home is located at 159 1st St, Keyport, NJ 07735 and is currently estimated at $650,870, approximately $356 per square foot. 159 1st St is a home located in Monmouth County with nearby schools including Keyport Central School, Keyport High School, and Icob Academy.
Ownership History
Date
Name
Owned For
Owner Type
Purchase Details
Closed on
Feb 1, 2010
Sold by
Gordon Jay and Rudolph Harriet
Bought by
Chamberlain William O
Current Estimated Value
Home Financials for this Owner
Home Financials are based on the most recent Mortgage that was taken out on this home.
Original Mortgage
$279,200
Outstanding Balance
$184,691
Interest Rate
5.02%
Mortgage Type
New Conventional
Estimated Equity
$466,179
Purchase Details
Closed on
Jan 18, 1994
Sold by
Estate Of Wilbur Huylar
Bought by
Gordon Jay and Rudolph Harriet
Home Financials for this Owner
Home Financials are based on the most recent Mortgage that was taken out on this home.
Original Mortgage
$101,000
Interest Rate
7.11%
Create a Home Valuation Report for This Property
The Home Valuation Report is an in-depth analysis detailing your home's value as well as a comparison with similar homes in the area
Home Values in the Area
Average Home Value in this Area
Purchase History
| Date | Buyer | Sale Price | Title Company |
|---|---|---|---|
| Chamberlain William O | $349,000 | Chicago Title Insurance Co | |
| Gordon Jay | $126,500 | -- |
Source: Public Records
Mortgage History
| Date | Status | Borrower | Loan Amount |
|---|---|---|---|
| Open | Chamberlain William O | $279,200 | |
| Previous Owner | Gordon Jay | $101,000 |
Source: Public Records
Tax History Compared to Growth
Tax History
| Year | Tax Paid | Tax Assessment Tax Assessment Total Assessment is a certain percentage of the fair market value that is determined by local assessors to be the total taxable value of land and additions on the property. | Land | Improvement |
|---|---|---|---|---|
| 2025 | $12,377 | $647,400 | $198,700 | $448,700 |
| 2024 | $11,953 | $597,900 | $171,300 | $426,600 |
| 2023 | $11,953 | $543,800 | $155,700 | $388,100 |
| 2022 | $10,772 | $472,800 | $135,400 | $337,400 |
| 2021 | $10,772 | $426,800 | $125,400 | $301,400 |
| 2020 | $10,355 | $407,200 | $120,700 | $286,500 |
| 2019 | $10,060 | $396,200 | $116,200 | $280,000 |
| 2018 | $9,381 | $360,800 | $98,800 | $262,000 |
| 2017 | $9,255 | $355,000 | $96,300 | $258,700 |
| 2016 | $8,934 | $345,600 | $96,300 | $249,300 |
| 2015 | $8,692 | $334,700 | $88,800 | $245,900 |
| 2014 | $7,629 | $296,600 | $63,800 | $232,800 |
Source: Public Records
Map
Nearby Homes