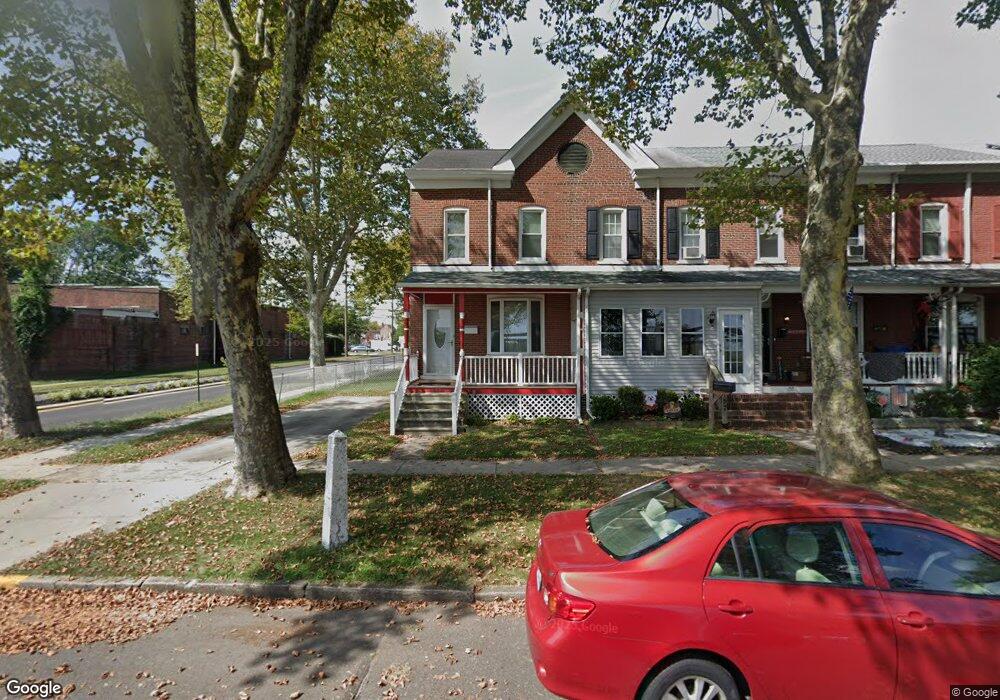
159 2nd Ave Roebling, NJ 08554
Estimated Value: $223,000 - $283,000
2
Beds
2
Baths
1,152
Sq Ft
$219/Sq Ft
Est. Value
About This Home
This home is located at 159 2nd Ave, Roebling, NJ 08554 and is currently estimated at $251,969, approximately $218 per square foot. 159 2nd Ave is a home located in Burlington County with nearby schools including Number 5, Roebling Elementary School, Riverfront Middle School, and Florence Twp Mem High School.
Ownership History
Date
Name
Owned For
Owner Type
Purchase Details
Closed on
Feb 15, 2008
Sold by
Nucifora Steven M and Nucifora Jaime L
Bought by
Gaydos Theodore S
Current Estimated Value
Home Financials for this Owner
Home Financials are based on the most recent Mortgage that was taken out on this home.
Original Mortgage
$124,000
Outstanding Balance
$77,559
Interest Rate
5.9%
Mortgage Type
Purchase Money Mortgage
Estimated Equity
$174,410
Purchase Details
Closed on
Oct 22, 2003
Sold by
Stillwell Carsley Karen L and Carsley Joseph E
Bought by
Nucifora Steven M and Nucifora Jaime L
Home Financials for this Owner
Home Financials are based on the most recent Mortgage that was taken out on this home.
Original Mortgage
$74,400
Interest Rate
5.81%
Mortgage Type
Purchase Money Mortgage
Purchase Details
Closed on
Aug 16, 1995
Sold by
Fazekas Margaret I
Bought by
Stillwell Karen L
Create a Home Valuation Report for This Property
The Home Valuation Report is an in-depth analysis detailing your home's value as well as a comparison with similar homes in the area
Home Values in the Area
Average Home Value in this Area
Purchase History
| Date | Buyer | Sale Price | Title Company |
|---|---|---|---|
| Gaydos Theodore S | $155,000 | None Available | |
| Nucifora Steven M | $93,000 | Presidential Title Agency In | |
| Stillwell Karen L | $64,000 | T A Title Insurance Company |
Source: Public Records
Mortgage History
| Date | Status | Borrower | Loan Amount |
|---|---|---|---|
| Open | Gaydos Theodore S | $124,000 | |
| Previous Owner | Nucifora Steven M | $74,400 |
Source: Public Records
Tax History
| Year | Tax Paid | Tax Assessment Tax Assessment Total Assessment is a certain percentage of the fair market value that is determined by local assessors to be the total taxable value of land and additions on the property. | Land | Improvement |
|---|---|---|---|---|
| 2025 | $3,827 | $137,300 | $52,500 | $84,800 |
| 2024 | $3,663 | $137,300 | $52,500 | $84,800 |
| 2023 | $3,663 | $137,300 | $52,500 | $84,800 |
| 2022 | $3,585 | $137,300 | $52,500 | $84,800 |
| 2021 | $3,553 | $137,300 | $52,500 | $84,800 |
| 2020 | $3,540 | $137,300 | $52,500 | $84,800 |
| 2019 | $3,508 | $137,300 | $52,500 | $84,800 |
| 2018 | $3,478 | $137,300 | $52,500 | $84,800 |
| 2017 | $3,435 | $137,300 | $52,500 | $84,800 |
| 2016 | $3,369 | $137,300 | $52,500 | $84,800 |
| 2015 | $3,301 | $137,300 | $52,500 | $84,800 |
| 2014 | $3,557 | $152,200 | $52,500 | $99,700 |
Source: Public Records
Map
Nearby Homes
- 132 4th Ave
- 226 4th Ave
- 125 4th Ave
- 1448 Hornberger Ave
- 214 5th Ave
- 110 5th Ave
- 256 6th Ave
- 17 4th Ave
- 77 Railroad Ave
- 71 Amboy Ave
- 149 7th Ave
- 101 Main St
- 32 River Bank Dr
- 213 Birch Hollow Dr Unit 213
- 809 Olive St
- 184 Birch Hollow Dr Unit 58
- 1036 Potts Mill Rd
- 2075 Route 130 N
- 3 Wyndam Place
- 101 Ridgway Dr
Your Personal Tour Guide
Ask me questions while you tour the home.