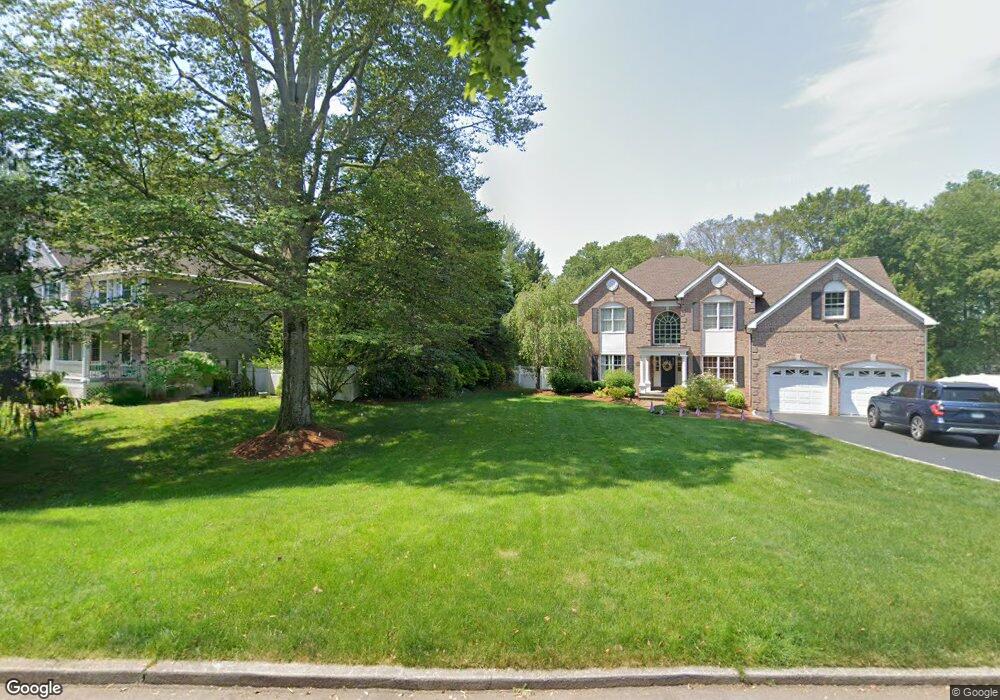
159 Acorn Ln Southport, CT 06890
Estimated Value: $1,678,000 - $2,092,000
4
Beds
4
Baths
3,500
Sq Ft
$551/Sq Ft
Est. Value
About This Home
This home is located at 159 Acorn Ln, Southport, CT 06890 and is currently estimated at $1,927,514, approximately $550 per square foot. 159 Acorn Ln is a home located in Fairfield County with nearby schools including Mill Hill School, Roger Ludlowe Middle School, and Fairfield Ludlowe High School.
Ownership History
Date
Name
Owned For
Owner Type
Purchase Details
Closed on
Apr 3, 2018
Sold by
Macca Laura
Bought by
Caserta Anthony and Caserta Michelle
Current Estimated Value
Home Financials for this Owner
Home Financials are based on the most recent Mortgage that was taken out on this home.
Original Mortgage
$600,000
Outstanding Balance
$515,269
Interest Rate
4.38%
Mortgage Type
Purchase Money Mortgage
Estimated Equity
$1,412,245
Purchase Details
Closed on
Aug 16, 2001
Sold by
Lynch John F
Bought by
Ault William D and Ault Laura M
Purchase Details
Closed on
Nov 17, 1999
Sold by
Powers Marylou Z
Bought by
Lynch John F
Purchase Details
Closed on
Mar 26, 1996
Sold by
Cavaliere & Sons Inc
Bought by
Powers Marylou Z
Create a Home Valuation Report for This Property
The Home Valuation Report is an in-depth analysis detailing your home's value as well as a comparison with similar homes in the area
Home Values in the Area
Average Home Value in this Area
Purchase History
| Date | Buyer | Sale Price | Title Company |
|---|---|---|---|
| Caserta Anthony | $900,000 | -- | |
| Caserta Anthony | $900,000 | -- | |
| Ault William D | $935,000 | -- | |
| Ault William D | $935,000 | -- | |
| Lynch John F | $875,000 | -- | |
| Lynch John F | $875,000 | -- | |
| Powers Marylou Z | $543,000 | -- | |
| Powers Marylou Z | $543,000 | -- |
Source: Public Records
Mortgage History
| Date | Status | Borrower | Loan Amount |
|---|---|---|---|
| Open | Powers Marylou Z | $600,000 | |
| Closed | Powers Marylou Z | $600,000 |
Source: Public Records
Tax History Compared to Growth
Tax History
| Year | Tax Paid | Tax Assessment Tax Assessment Total Assessment is a certain percentage of the fair market value that is determined by local assessors to be the total taxable value of land and additions on the property. | Land | Improvement |
|---|---|---|---|---|
| 2025 | $21,465 | $756,070 | $323,400 | $432,670 |
| 2024 | $21,094 | $756,070 | $323,400 | $432,670 |
| 2023 | $20,799 | $756,070 | $323,400 | $432,670 |
| 2022 | $20,595 | $756,070 | $323,400 | $432,670 |
| 2021 | $20,399 | $756,070 | $323,400 | $432,670 |
| 2020 | $20,658 | $771,120 | $319,900 | $451,220 |
| 2019 | $20,658 | $771,120 | $319,900 | $451,220 |
| 2018 | $20,327 | $771,120 | $319,900 | $451,220 |
| 2017 | $19,910 | $771,120 | $319,900 | $451,220 |
| 2016 | $19,625 | $771,120 | $319,900 | $451,220 |
| 2015 | $20,324 | $819,840 | $320,530 | $499,310 |
| 2014 | $20,004 | $819,840 | $320,530 | $499,310 |
Source: Public Records
Map
Nearby Homes
- 153 Pease Ave
- 844 Mill Hill Terrace
- 2 Elmwood Dr Unit 2
- 476 Mill Hill Terrace
- 28 Mill Hill Rd Unit 28
- 1135 Mill Hill Rd
- 53 Hilltop Dr
- 125 Old Rd
- 1213 Cedar Rd
- 647 Bronson Rd
- 1001 Hulls Farm Rd
- 1 Coastal Ct
- 107 Old Rd
- 305 S Gate Ln
- 944 Pequot Ave
- 220 Lansdowne
- 100 Overhill Rd
- 688 Hulls Farm Rd
- 88 Overhill Rd
- 1 Sturges Hwy Unit Lot 1