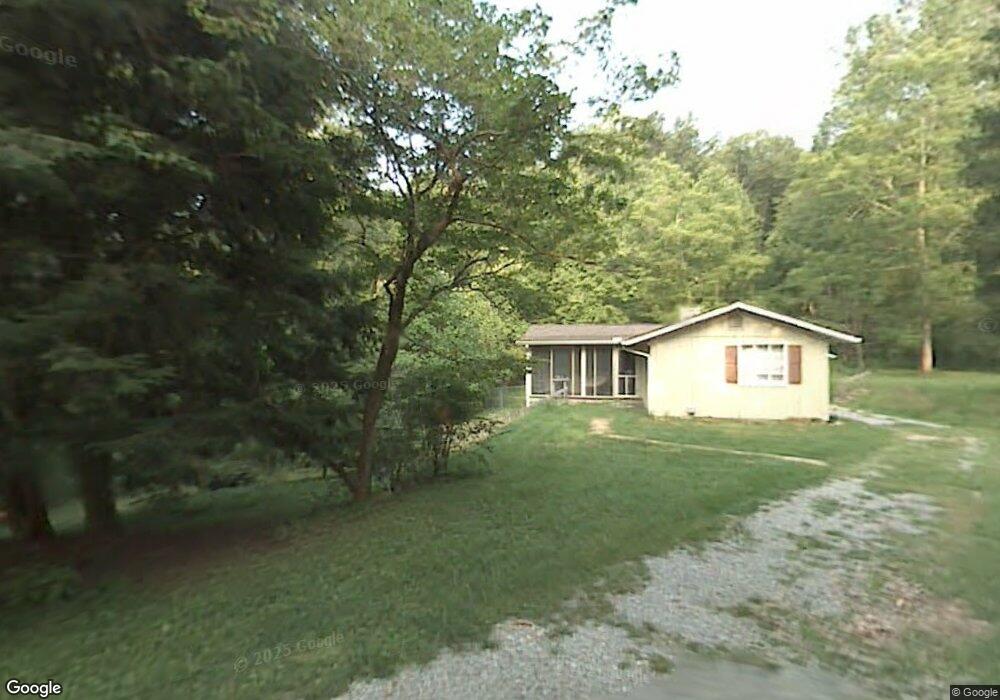
159 Bagby Ln Lookout Mountain, GA 30750
Estimated Value: $292,000 - $367,000
--
Bed
1
Bath
973
Sq Ft
$338/Sq Ft
Est. Value
About This Home
This home is located at 159 Bagby Ln, Lookout Mountain, GA 30750 and is currently estimated at $328,807, approximately $337 per square foot. 159 Bagby Ln is a home located in Walker County with nearby schools including Fairyland Elementary School, Chattanooga Valley Middle School, and Ridgeland High School.
Ownership History
Date
Name
Owned For
Owner Type
Purchase Details
Closed on
Aug 16, 2024
Sold by
Persinger Joseph B
Bought by
Persinger Jessica C and Persinger Joseph B
Current Estimated Value
Purchase Details
Closed on
May 27, 2021
Sold by
Persinger Stephen
Bought by
Persinger Joseph B
Purchase Details
Closed on
Nov 26, 2008
Sold by
Not Provided
Bought by
Persinger Stephen C
Purchase Details
Closed on
Feb 17, 2004
Sold by
Epps Jessie Miller and Epps Wife
Bought by
Persinger Stephen C and Persinger Karen
Purchase Details
Closed on
Nov 12, 2002
Sold by
Epps Epps J and Epps Ann G
Bought by
Epps Jessie Miller and Epps Wife
Purchase Details
Closed on
Mar 6, 1997
Sold by
Millard Alice M
Bought by
Epps Epps J and Epps Ann G
Purchase Details
Closed on
Apr 20, 1949
Bought by
Millard Alice M
Create a Home Valuation Report for This Property
The Home Valuation Report is an in-depth analysis detailing your home's value as well as a comparison with similar homes in the area
Home Values in the Area
Average Home Value in this Area
Purchase History
| Date | Buyer | Sale Price | Title Company |
|---|---|---|---|
| Persinger Jessica C | -- | -- | |
| Persinger Joseph B | $100,000 | -- | |
| Persinger Stephen C | -- | -- | |
| Persinger Stephen C | $100,000 | -- | |
| Epps Jessie Miller | -- | -- | |
| Epps Epps J | $50,000 | -- | |
| Millard Alice M | -- | -- |
Source: Public Records
Tax History Compared to Growth
Tax History
| Year | Tax Paid | Tax Assessment Tax Assessment Total Assessment is a certain percentage of the fair market value that is determined by local assessors to be the total taxable value of land and additions on the property. | Land | Improvement |
|---|---|---|---|---|
| 2024 | $4,547 | $144,209 | $75,000 | $69,209 |
| 2023 | $4,460 | $140,614 | $75,000 | $65,614 |
| 2022 | $3,274 | $124,377 | $75,000 | $49,377 |
| 2021 | $3,149 | $107,224 | $76,200 | $31,024 |
| 2020 | $3,079 | $100,349 | $76,200 | $24,149 |
| 2019 | $3,080 | $100,349 | $76,200 | $24,149 |
| 2018 | $2,985 | $100,349 | $76,200 | $24,149 |
| 2017 | $3,336 | $100,349 | $76,200 | $24,149 |
| 2016 | $1,611 | $58,439 | $34,290 | $24,149 |
| 2015 | $1,323 | $45,726 | $27,516 | $18,210 |
| 2014 | $1,274 | $45,726 | $27,516 | $18,210 |
| 2013 | -- | $45,726 | $27,516 | $18,210 |
Source: Public Records
Map
Nearby Homes
- 1612 Lula Lake Rd
- 401 Mcfarland Rd
- 302 Mcfarland Rd
- 1601 Wood Nymph Trail
- 1613 Fairy Dell Trail
- 1300 Elfin Rd
- 1212 Cinderella Rd
- 504 Frontier Bluff Rd
- 1211 Cinderella Rd
- 106 Founding Way
- 154 Founding Way Unit B
- 0 Fleetwood Dr Unit RTC2957879
- 0 Fleetwood Dr Unit 1517351
- 31 Krupski Loop
- 0 Tinker Bell Cir Unit LOT 27 10563269
- 0 Tinker Bell Cir Unit 1510010
- 219 Gnome Trail
- 891 Fleetwood Dr
- 196 Fort Stephenson Place
- 0 Bagby Ln Unit 965881
- 0 Bagby Ln Unit 931969
- 0 Bagby Ln
- 20 Turnberry Ct
- 22 Turnberry Ct
- 262 Turnberry Ln
- 4 Turnberry Ln
- 7 Turnberry Ln
- 16 Bagby Ln
- 0 Bagby Lula Lake Rd
- 3 Turnberry Ln
- 323 Bagby Ln
- 1 Turnberry Ln
- 24 Turnberry Ln
- 0 Turnberry Ln Unit 1278585
- 0 Turnberry Ln Unit 18441
- 514 Turnberry Ln
- 0 Turnberry Ln Unit RTC2331258
- 1616 Lula Lake Rd
- 6 Turnberry Ln