NOT LISTED FOR SALE

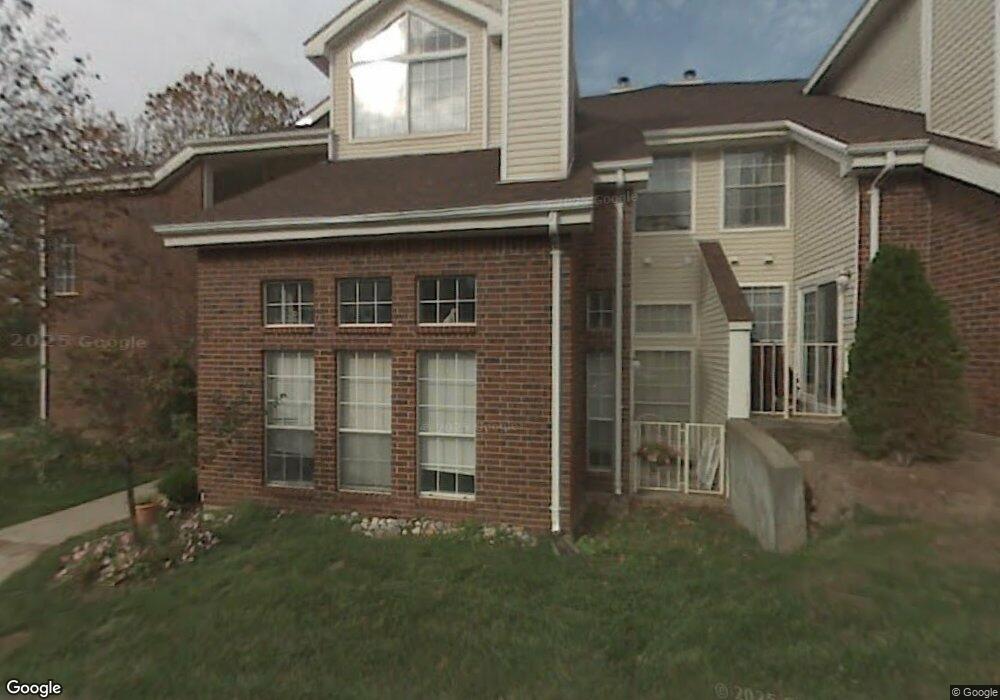
159 Carriage Crossing Ln Middletown, CT 06457

Westfield Neighborhood

Estimated Value: $169,000 - $176,000

1 Bed
1 Bath
760 Sq Ft
$226/Sq Ft Est. Value

About This Home

This home is located at 159 Carriage Crossing Ln, Middletown, CT 06457 and is currently estimated at $172,100, approximately $226 per square foot. 159 Carriage Crossing Ln is a home located in Middlesex County with nearby schools including Moody School and Middletown High School.

Ownership History

Date Name Owned For Owner Type

Purchase Details

Closed on
Jul 23, 2018
Sold by
Dipietro Anna M and Brancato Anthony G
Current Estimated Value
$172,100

Home Financials for this Owner

Home Financials are based on the most recent Mortgage that was taken out on this home.
Original Mortgage
$70,000
Outstanding Balance
$60,434
Interest Rate
3.75%
Mortgage Type
Adjustable Rate Mortgage/ARM
Estimated Equity
$114,696

Purchase Details

Closed on
Nov 23, 2015
Sold by
Faraci Cecilia L
Bought by
Dipietro Anna M and Brancato Anthony G

Home Financials for this Owner

Home Financials are based on the most recent Mortgage that was taken out on this home.
Original Mortgage
$81,900
Interest Rate
3.79%

Purchase Details

Closed on
Dec 17, 2014
Sold by
Ciaffaglione Carol and Ciaffaglione Carol A
Bought by
Faraci Cecilia L

Purchase Details

Closed on
Nov 4, 2014
Sold by
Ciaffaglione Sherry M
Bought by
Ciaffaglione Carol

Purchase Details

Closed on
May 28, 1999
Sold by
Emc Mtg Corp
Bought by
Ciaffaglione Carol and Ciaffaglione Sherry
Source: Public Records

Range of Values:

Collateral Analytics

Collateral Analytics Collateral Analytics AVMs (Automated Valuation Model) employ a number of statistical approaches combined with neighborhood-specific comparable selection guarantees the most up-to-date and precise valuations.

Not Available

Collateral Analytics does not have data for the current month. Please view the chart for historical values.

ICE

ICE Mortgage Technology ICE Mortgage Technology’s AVM (Automated Valuation Model) is a state-of-the-art online residential property valuation tool that provides a quick and accurate estimate of the value of almost any home in the U.S.

Not Available

ICE Mortgage Technology does not have data for the current month. Please view the chart for historical values.

First American

First American First American Data & Analytics’ next-generation AVM combines unrivaled data assets with a blended ensemble of valuation models to produce highly accurate, reliable valuations you can trust.

Not Available

First American does not have data for the current month. Please view the chart for historical values.

Quantarium

Quantarium Quantarium’s valuation service, repeatedly proven the industry’s most accurate and comprehensive, is supercharged with a self-learning and auto-tuning AI engine that continually becomes smarter and more accurate as it processes daily inputs from the industry’s leading RE data lake.

Not Available

Quantarium does not have data for the current month. Please view the chart for historical values.

Average Value
Not Available
List Price
Sold Price
Create a Home Valuation Report for This Property
The Home Valuation Report is an in-depth analysis detailing your home's value as well as a comparison with similar homes in the area

Home Values in the Area

Source: Public Records

Average Home Value in this Area


Source: Public Records

Purchase History

Date Buyer Sale Price Title Company
-- $89,500 --
Dipietro Anna M $91,000 --
Faraci Cecilia L $53,000 --
Ciaffaglione Carol -- --
Ciaffaglione Carol $47,000 --
Source: Public Records

Mortgage History

Date Status Borrower Loan Amount
Open -- $70,000
Previous Owner Dipietro Anna M $81,900
Source: Public Records

Tax History Compared to Growth

Source: Public Records

Tax History

Year Tax Paid Tax Assessment Tax Assessment Total Assessment is a certain percentage of the fair market value that is determined by local assessors to be the total taxable value of land and additions on the property. Land Improvement
2024 $2,655 $83,120 $0 $83,120
2023 $2,497 $83,120 $0 $83,120
2022 $2,217 $59,090 $0 $59,090
2021 $2,212 $59,090 $0 $59,090
2020 $2,215 $59,090 $0 $59,090
2019 $2,227 $59,090 $0 $59,090
2018 $2,148 $59,090 $0 $59,090
2017 $2,613 $73,700 $0 $73,700
2016 $2,562 $73,700 $0 $73,700
2015 $2,507 $73,700 $0 $73,700
2014 $2,508 $73,700 $0 $73,700
Source: Public Records

Map