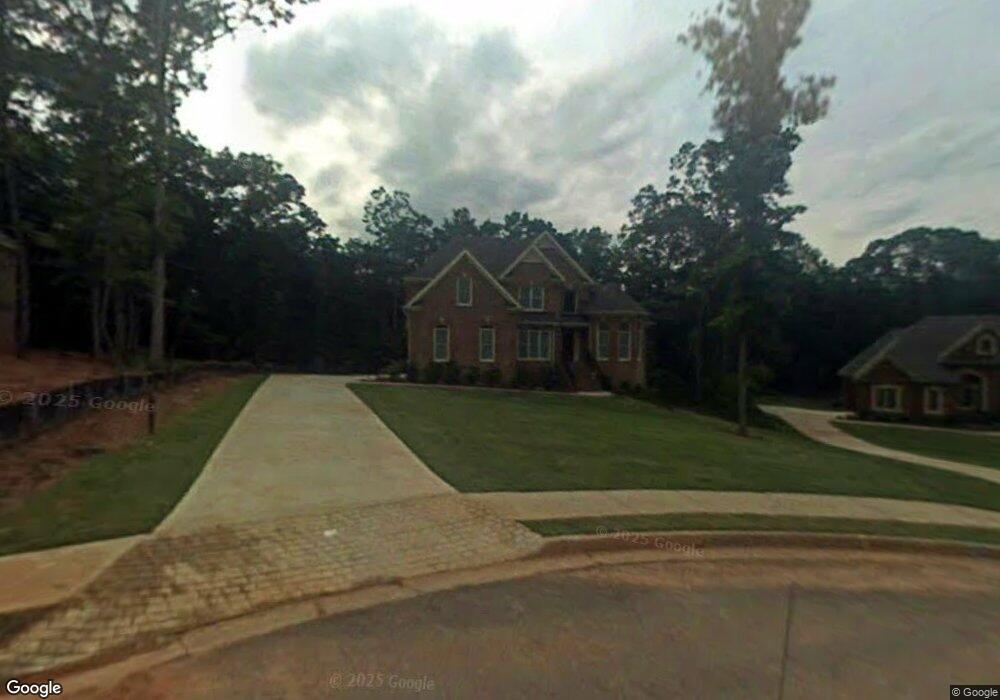
159 Chapel Ridge Dr Unit 2 Ellenwood, GA 30294
Estimated Value: $480,296 - $635,000
5
Beds
4
Baths
2,632
Sq Ft
$224/Sq Ft
Est. Value
About This Home
This home is located at 159 Chapel Ridge Dr Unit 2, Ellenwood, GA 30294 and is currently estimated at $588,574, approximately $223 per square foot. 159 Chapel Ridge Dr Unit 2 is a home located in Henry County with nearby schools including Austin Road Elementary School, Austin Road Middle School, and Woodland High School.
Ownership History
Date
Name
Owned For
Owner Type
Purchase Details
Closed on
May 9, 2025
Sold by
Hardiman Wanda P
Bought by
Hardiman Wanda Perry
Current Estimated Value
Purchase Details
Closed on
Jul 23, 2007
Sold by
Clairmont Dev Inc
Bought by
Hardiman Moses and Hardiman Wanda P
Home Financials for this Owner
Home Financials are based on the most recent Mortgage that was taken out on this home.
Original Mortgage
$275,000
Interest Rate
6.65%
Mortgage Type
New Conventional
Purchase Details
Closed on
Jan 10, 2007
Sold by
Primo Dev Corp
Bought by
Clairmont Dev Inc
Home Financials for this Owner
Home Financials are based on the most recent Mortgage that was taken out on this home.
Original Mortgage
$282,375
Interest Rate
6.08%
Create a Home Valuation Report for This Property
The Home Valuation Report is an in-depth analysis detailing your home's value as well as a comparison with similar homes in the area
Home Values in the Area
Average Home Value in this Area
Purchase History
| Date | Buyer | Sale Price | Title Company |
|---|---|---|---|
| Hardiman Wanda Perry | -- | -- | |
| Hardiman Moses | $376,500 | -- | |
| Clairmont Dev Inc | $42,500 | -- |
Source: Public Records
Mortgage History
| Date | Status | Borrower | Loan Amount |
|---|---|---|---|
| Previous Owner | Hardiman Moses | $275,000 | |
| Previous Owner | Clairmont Dev Inc | $282,375 |
Source: Public Records
Tax History Compared to Growth
Tax History
| Year | Tax Paid | Tax Assessment Tax Assessment Total Assessment is a certain percentage of the fair market value that is determined by local assessors to be the total taxable value of land and additions on the property. | Land | Improvement |
|---|---|---|---|---|
| 2025 | $2,364 | $236,040 | $20,000 | $216,040 |
| 2024 | $2,364 | $220,800 | $20,000 | $200,800 |
| 2023 | $1,922 | $202,600 | $18,000 | $184,600 |
| 2022 | $1,978 | $167,400 | $18,000 | $149,400 |
| 2021 | $1,978 | $144,560 | $18,000 | $126,560 |
| 2020 | $2,483 | $142,240 | $12,000 | $130,240 |
| 2019 | $2,354 | $138,880 | $12,000 | $126,880 |
| 2018 | $5,040 | $136,280 | $12,000 | $124,280 |
| 2016 | $4,266 | $116,120 | $10,000 | $106,120 |
| 2015 | $3,577 | $95,640 | $10,000 | $85,640 |
| 2014 | $3,539 | $93,720 | $10,000 | $83,720 |
Source: Public Records
Map
Nearby Homes
- 168 Chapel Ridge Dr
- 160 Chapel Ridge Dr
- 500 Saint Sambar Dr
- 565 Scarborough Rd
- 0 Kingsbrook Dr Unit 19 LOTS 10399843
- 429 Saint Surrey Way
- 444 Cauthen Ct
- 116 Kalsum Trail
- 107 S Circle Dr
- 1414 Panola Rd
- 963 Blackberry Ct
- 907 Strawberry Ct
- 103 N Circle Dr
- 4241 Hearn Rd
- 270 Huckleberry Ln
- 4923 Amsler Rd
- 176 Fairoaks Cir
- 5520 Hearn Rd
- 115 Elizabeth Way
- 204 Benefield Ct
- 155 Chapel Ridge Dr Unit 112
- 155 Chapel Ridge Dr
- 163 Chapel Ridge Dr
- 120 Whirlaway Dr
- 151 Chapel
- 168 Chapel Ridge Dr Unit 109
- 151 Chapel Ridge Dr Unit 113
- 151 Chapel Ridge Dr
- 156 Chapel Ridge Dr
- 156 Chapel Ridge Dr Unit 2
- 164 Chapel Ridge Dr
- 118 Whirlaway Dr
- 147 Chapel Ridge Dr
- 160 Chapel Ridge Dr Unit 107
- 152 Chapel Ridge Dr
- 117 Whirlaway Dr
- 231 Pineknoll Ct
- 227 Pineknoll Ct Unit IV/103
- 227 Pineknoll Ct
- 148 Chapel Ridge Dr