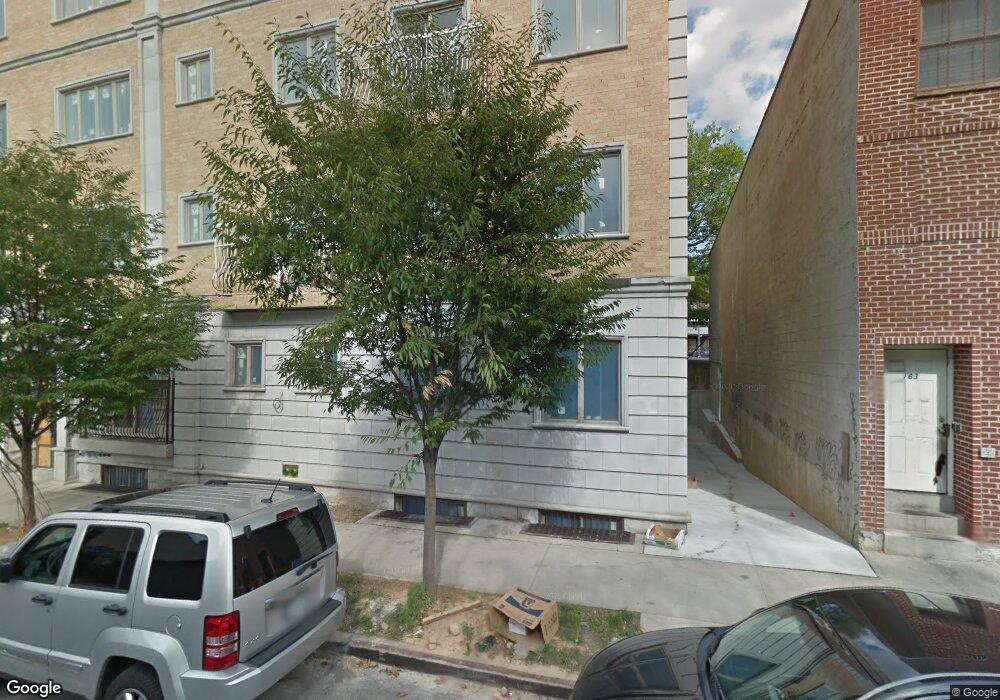
159 Classon Ave Unit 4C Brooklyn, NY 11205
Bed-Stuy NeighborhoodEstimated Value: $929,000 - $1,387,000
Studio
--
Bath
1,668
Sq Ft
$690/Sq Ft
Est. Value
About This Home
This home is located at 159 Classon Ave Unit 4C, Brooklyn, NY 11205 and is currently estimated at $1,151,489, approximately $690 per square foot. 159 Classon Ave Unit 4C is a home located in Kings County with nearby schools including P.S. 157 Benjamin Franklin, Success Academy Charter School-NYC 9, and Trilok School.
Ownership History
Date
Name
Owned For
Owner Type
Purchase Details
Closed on
Sep 5, 2024
Sold by
Moscovics Moshe and Moskovics Chaya
Bought by
159 Classon 4C Llc
Current Estimated Value
Purchase Details
Closed on
Sep 21, 2018
Sold by
159 Classon 4C Llc
Bought by
Moskovics Moshe
Purchase Details
Closed on
Nov 10, 2015
Sold by
Moskovics Chaya and Moskovics Moshe
Bought by
159 Classon 4C Llc
Home Financials for this Owner
Home Financials are based on the most recent Mortgage that was taken out on this home.
Original Mortgage
$450,000
Interest Rate
3.97%
Mortgage Type
New Conventional
Purchase Details
Closed on
Sep 11, 2015
Sold by
Classon Estates One Llc
Bought by
Moskovics Chaya and Moskovics Moshe
Home Financials for this Owner
Home Financials are based on the most recent Mortgage that was taken out on this home.
Original Mortgage
$450,000
Interest Rate
3.97%
Mortgage Type
New Conventional
Create a Home Valuation Report for This Property
The Home Valuation Report is an in-depth analysis detailing your home's value as well as a comparison with similar homes in the area
Home Values in the Area
Average Home Value in this Area
Purchase History
| Date | Buyer | Sale Price | Title Company |
|---|---|---|---|
| 159 Classon 4C Llc | -- | -- | |
| 159 Classon 4C Llc | -- | -- | |
| Moskovics Moshe | -- | -- | |
| Moskovics Moshe | -- | -- | |
| Moskovics Moshe | -- | -- | |
| 159 Classon 4C Llc | -- | -- | |
| 159 Classon 4C Llc | -- | -- | |
| 159 Classon 4C Llc | -- | -- | |
| Moskovics Chaya | $635,184 | -- | |
| Moskovics Chaya | $635,184 | -- | |
| Moskovics Chaya | $635,184 | -- |
Source: Public Records
Mortgage History
| Date | Status | Borrower | Loan Amount |
|---|---|---|---|
| Previous Owner | Moskovics Chaya | $450,000 |
Source: Public Records
Tax History
| Year | Tax Paid | Tax Assessment Tax Assessment Total Assessment is a certain percentage of the fair market value that is determined by local assessors to be the total taxable value of land and additions on the property. | Land | Improvement |
|---|---|---|---|---|
| 2025 | $742 | $136,890 | $8,243 | $128,647 |
| 2024 | $742 | $130,009 | $8,243 | $121,766 |
| 2023 | $728 | $125,600 | $8,243 | $117,357 |
| 2022 | $726 | $126,354 | $8,243 | $118,111 |
| 2021 | $728 | $96,558 | $8,243 | $88,315 |
| 2019 | $749 | $109,808 | $8,243 | $101,565 |
| 2018 | $755 | $97,583 | $8,244 | $89,339 |
| 2017 | $755 | $101,079 | $8,244 | $92,835 |
| 2016 | $765 | $99,943 | $8,243 | $91,700 |
Source: Public Records
Map
Nearby Homes
- 111 Steuben St Unit 2D
- 609 Myrtle Ave Unit 2A
- 609 Myrtle Ave Unit 4C
- 91 Grand Ave Unit 2A
- 91 Grand Ave Unit 3G
- 764 Kent Ave Unit 2
- 525 Myrtle Ave Unit 701
- 116 Ryerson St
- 116 Ryerson St Unit 2
- 195 Willoughby Ave Unit 1708
- 195 Willoughby Ave Unit 1206
- 195 Willoughby Ave Unit 112
- 102 Hall St
- 116 Hall St
- 126 Hall St
- 124 Hall St
- 689 Myrtle Ave Unit 3D
- 689 Myrtle Ave Unit 4F
- 185 Hall St Unit 614
- 185 Hall St Unit 1710
- 159 Classon Ave Unit 2B
- 159 Classon Ave Unit 3D
- 159 Classon Ave Unit P2
- 159 Classon Ave Unit P15
- 159 Classon Ave Unit REC6
- 159 Classon Ave Unit P14
- 159 Classon Ave Unit 1C
- 159 Classon Ave Unit REC2
- 159 Classon Ave Unit 5D
- 159 Classon Ave Unit R1
- 159 Classon Ave Unit REC3
- 159 Classon Ave Unit REC1
- 159 Classon Ave Unit P3
- 159 Classon Ave Unit P6
- 159 Classon Ave Unit 3B
- 159 Classon Ave Unit P4
- 159 Classon Ave Unit REC4
- 159 Classon Ave Unit 2D
- 159 Classon Ave Unit P13
- 159 Classon Ave Unit P1
Your Personal Tour Guide
Ask me questions while you tour the home.