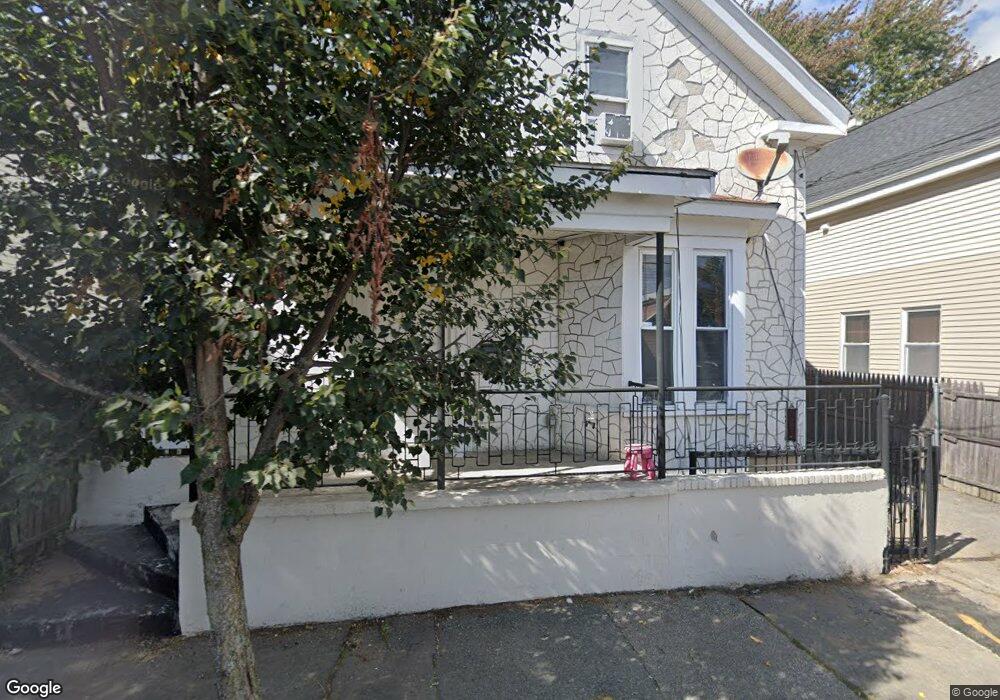
159 Colfax St Providence, RI 02905
Lower South Providence NeighborhoodEstimated Value: $313,000 - $401,155
3
Beds
2
Baths
1,347
Sq Ft
$275/Sq Ft
Est. Value
About This Home
This home is located at 159 Colfax St, Providence, RI 02905 and is currently estimated at $370,789, approximately $275 per square foot. 159 Colfax St is a home located in Providence County with nearby schools including Highlander Charter School and Bishop Mcvinney Elementary School.
Ownership History
Date
Name
Owned For
Owner Type
Purchase Details
Closed on
Apr 15, 2003
Sold by
Sime Librado and Tejada Juana
Bought by
Matias Amaury
Current Estimated Value
Home Financials for this Owner
Home Financials are based on the most recent Mortgage that was taken out on this home.
Original Mortgage
$94,050
Interest Rate
5.86%
Purchase Details
Closed on
Apr 1, 1996
Sold by
Greenwood Cu
Bought by
Sime Librado and Tejada Juana
Purchase Details
Closed on
Sep 24, 1993
Sold by
Greenwood Credit Union
Bought by
Ploettner Chester N and Ploettner Winifred
Create a Home Valuation Report for This Property
The Home Valuation Report is an in-depth analysis detailing your home's value as well as a comparison with similar homes in the area
Home Values in the Area
Average Home Value in this Area
Purchase History
| Date | Buyer | Sale Price | Title Company |
|---|---|---|---|
| Matias Amaury | $99,000 | -- | |
| Sime Librado | $10,000 | -- | |
| Ploettner Chester N | $46,000 | -- |
Source: Public Records
Mortgage History
| Date | Status | Borrower | Loan Amount |
|---|---|---|---|
| Open | Ploettner Chester N | $104,000 | |
| Closed | Ploettner Chester N | $94,050 | |
| Previous Owner | Ploettner Chester N | $63,750 |
Source: Public Records
Tax History
| Year | Tax Paid | Tax Assessment Tax Assessment Total Assessment is a certain percentage of the fair market value that is determined by local assessors to be the total taxable value of land and additions on the property. | Land | Improvement |
|---|---|---|---|---|
| 2025 | $2,664 | $317,200 | $118,500 | $198,700 |
| 2024 | $4,186 | $228,100 | $75,100 | $153,000 |
| 2023 | $4,186 | $228,100 | $75,100 | $153,000 |
| 2022 | $4,060 | $228,100 | $75,100 | $153,000 |
| 2021 | $3,333 | $135,700 | $33,100 | $102,600 |
| 2020 | $3,333 | $135,700 | $33,100 | $102,600 |
| 2019 | $3,333 | $135,700 | $33,100 | $102,600 |
| 2018 | $3,270 | $102,300 | $30,100 | $72,200 |
| 2017 | $3,270 | $102,300 | $30,100 | $72,200 |
| 2016 | $3,270 | $102,300 | $30,100 | $72,200 |
| 2015 | $3,035 | $91,700 | $30,100 | $61,600 |
| 2014 | $3,095 | $91,700 | $30,100 | $61,600 |
| 2013 | $3,095 | $91,700 | $30,100 | $61,600 |
Source: Public Records
Map
Nearby Homes
Your Personal Tour Guide
Ask me questions while you tour the home.