Estimated Value: $216,000 - $341,730
4
Beds
2
Baths
3,072
Sq Ft
$94/Sq Ft
Est. Value
About This Home
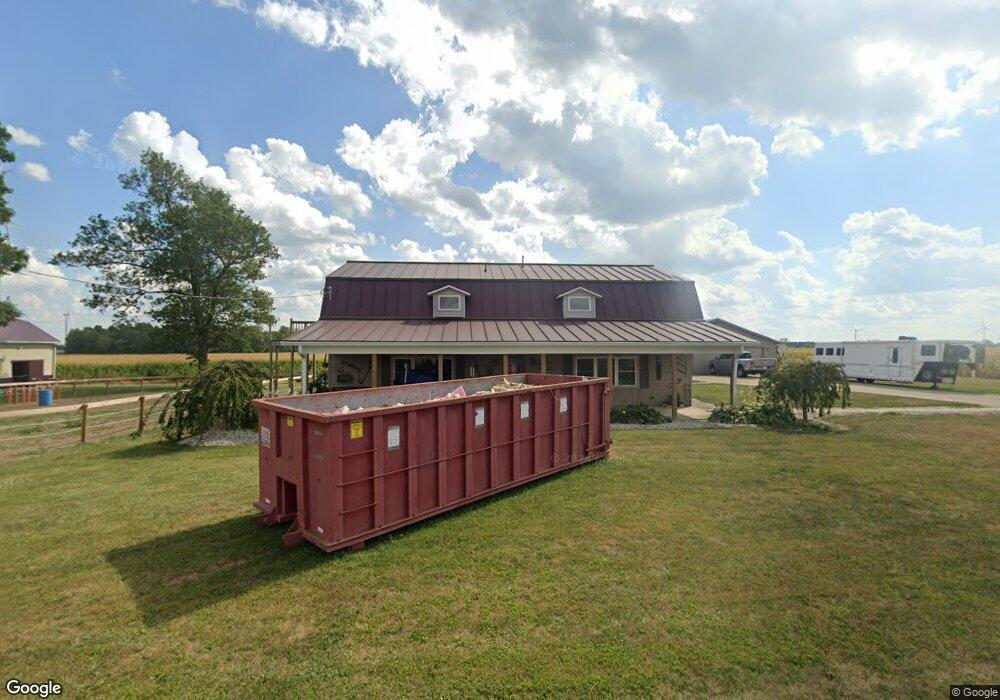
This home is located at 159 E 600 S, Lynn, IN 47355 and is currently estimated at $288,433, approximately $93 per square foot. 159 E 600 S is a home located in Randolph County with nearby schools including Randolph Southern Elementary School and Randolph Southern Junior/Senior High School.
Ownership History
Date
Name
Owned For
Owner Type
Purchase Details
Closed on
May 1, 2025
Sold by
Berry Christina R
Bought by
Berry Jeffrey
Current Estimated Value
Purchase Details
Closed on
Aug 8, 2016
Sold by
Berry Jeffrey and Berry Christina R
Bought by
Berry Jeffrey and Berry Christina R
Purchase Details
Closed on
Oct 22, 2010
Sold by
Frazier Mary Beth
Bought by
Berry Jeffrey
Home Financials for this Owner
Home Financials are based on the most recent Mortgage that was taken out on this home.
Original Mortgage
$85,600
Interest Rate
4.37%
Mortgage Type
New Conventional
Purchase Details
Closed on
Dec 30, 2005
Sold by
Frazier Douglas
Bought by
Frazier Mary Beth
Create a Home Valuation Report for This Property
The Home Valuation Report is an in-depth analysis detailing your home's value as well as a comparison with similar homes in the area
Purchase History
| Date | Buyer | Sale Price | Title Company |
|---|---|---|---|
| Berry Jeffrey | -- | None Listed On Document | |
| Berry Jeffrey | -- | None Available | |
| Berry Jeffrey | -- | None Available | |
| Frazier Mary Beth | -- | None Available |
Source: Public Records
Mortgage History
| Date | Status | Borrower | Loan Amount |
|---|---|---|---|
| Previous Owner | Berry Jeffrey | $85,600 |
Source: Public Records
Tax History
| Year | Tax Paid | Tax Assessment Tax Assessment Total Assessment is a certain percentage of the fair market value that is determined by local assessors to be the total taxable value of land and additions on the property. | Land | Improvement |
|---|---|---|---|---|
| 2025 | $1,512 | $230,300 | $20,900 | $209,400 |
| 2024 | $1,512 | $214,500 | $16,000 | $198,500 |
| 2023 | $1,617 | $222,200 | $16,000 | $206,200 |
| 2022 | $1,907 | $222,400 | $16,000 | $206,400 |
| 2021 | $1,832 | $206,600 | $24,000 | $182,600 |
| 2020 | $1,640 | $188,000 | $20,900 | $167,100 |
| 2019 | $962 | $147,700 | $20,900 | $126,800 |
| 2018 | $884 | $139,400 | $19,800 | $119,600 |
| 2017 | $796 | $136,900 | $19,800 | $117,100 |
| 2016 | $697 | $126,000 | $18,000 | $108,000 |
| 2014 | $584 | $118,600 | $18,000 | $100,600 |
| 2013 | $584 | $115,300 | $18,000 | $97,300 |
Source: Public Records
Map
Nearby Homes
- 703 Westwood Dr
- 316 N Main St
- 306 Price St
- 1041 S Huntsville Rd
- 1027 S Huntsville Rd
- 6497 S 500 W
- 19 Deer Cross Dr
- 1033 S Huntsville Rd
- Lot 5 Huntsville Rd
- 889 S Huntsville Rd
- 810 S Elm Blvd
- 806 S Elm Blvd
- 114 E Orange St
- 4 Crestwood Dr
- 315 W Orange St
- 1319 Hopewell Rd
- 504 S Meridian St
- 401 W George St
- 404 E Thompson St
- 407 Westwood Dr
Your Personal Tour Guide
Ask me questions while you tour the home.