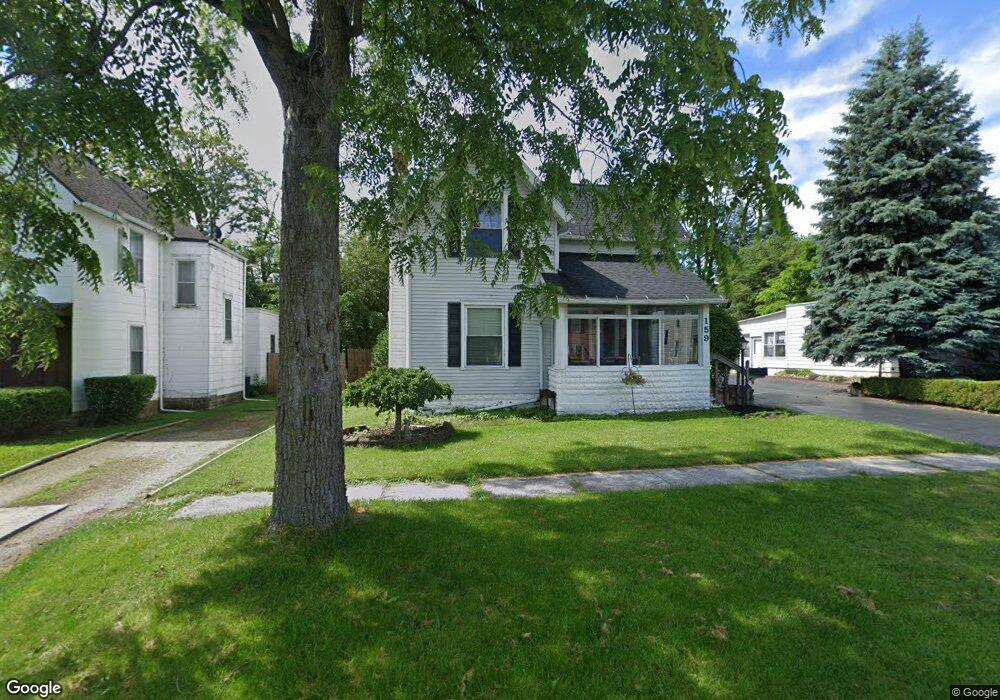
159 Elm St Fostoria, OH 44830
Estimated Value: $130,000 - $151,952
3
Beds
2
Baths
1,716
Sq Ft
$83/Sq Ft
Est. Value
About This Home
This home is located at 159 Elm St, Fostoria, OH 44830 and is currently estimated at $142,238, approximately $82 per square foot. 159 Elm St is a home located in Seneca County with nearby schools including Fostoria Intermediate Elementary School and Fostoria Junior/Senior High School.
Ownership History
Date
Name
Owned For
Owner Type
Purchase Details
Closed on
Sep 1, 2009
Sold by
Olmstead Jason R
Bought by
Smith Heather L
Current Estimated Value
Purchase Details
Closed on
Mar 9, 2006
Sold by
Olmstead Jason R and Olmstead Michelle A
Bought by
Smith Joshua J
Home Financials for this Owner
Home Financials are based on the most recent Mortgage that was taken out on this home.
Original Mortgage
$70,300
Interest Rate
6.5%
Mortgage Type
Seller Take Back
Purchase Details
Closed on
May 26, 1994
Sold by
Dodge Marjorie A
Bought by
Olmstead Jason R
Purchase Details
Closed on
Sep 25, 1992
Sold by
Dodge Charles L
Bought by
Dodge Marjorie A
Create a Home Valuation Report for This Property
The Home Valuation Report is an in-depth analysis detailing your home's value as well as a comparison with similar homes in the area
Home Values in the Area
Average Home Value in this Area
Purchase History
| Date | Buyer | Sale Price | Title Company |
|---|---|---|---|
| Smith Heather L | $78,000 | None Available | |
| Smith Joshua J | $78,000 | None Available | |
| Olmstead Jason R | $57,000 | -- | |
| Dodge Marjorie A | -- | -- |
Source: Public Records
Mortgage History
| Date | Status | Borrower | Loan Amount |
|---|---|---|---|
| Previous Owner | Smith Joshua J | $70,300 |
Source: Public Records
Tax History Compared to Growth
Tax History
| Year | Tax Paid | Tax Assessment Tax Assessment Total Assessment is a certain percentage of the fair market value that is determined by local assessors to be the total taxable value of land and additions on the property. | Land | Improvement |
|---|---|---|---|---|
| 2024 | $1,842 | $36,540 | $4,060 | $32,480 |
| 2023 | $3,732 | $36,540 | $4,060 | $32,480 |
| 2022 | $1,606 | $28,320 | $3,500 | $24,820 |
| 2021 | $1,641 | $28,320 | $3,500 | $24,820 |
| 2020 | $2,530 | $28,319 | $3,504 | $24,815 |
| 2019 | $1,603 | $27,335 | $3,381 | $23,954 |
| 2018 | $1,635 | $27,335 | $3,381 | $23,954 |
| 2017 | $1,447 | $27,335 | $3,381 | $23,954 |
| 2016 | $1,283 | $24,039 | $3,525 | $20,514 |
| 2015 | $1,990 | $24,039 | $3,525 | $20,514 |
| 2014 | $3,655 | $24,039 | $3,525 | $20,514 |
| 2013 | $3,655 | $25,964 | $3,833 | $22,131 |
Source: Public Records
Map
Nearby Homes
- 211 Summit St
- 520 N Union St
- 723 N Union St
- 633 Maple St
- 540 N Poplar St
- 931 N Union St
- 203 N Union St
- 892 N Countyline St
- 900 N Countyline St
- 321 Mcdougal St
- 207 W Culbertson St
- 603 N Vine St
- 509 College Ave
- 435 Park Ave
- 0 W South Route 12
- 348 W South St
- 351 W South St
- 827 Buckley St
- 901 Central Ave
- 1324 N Union St