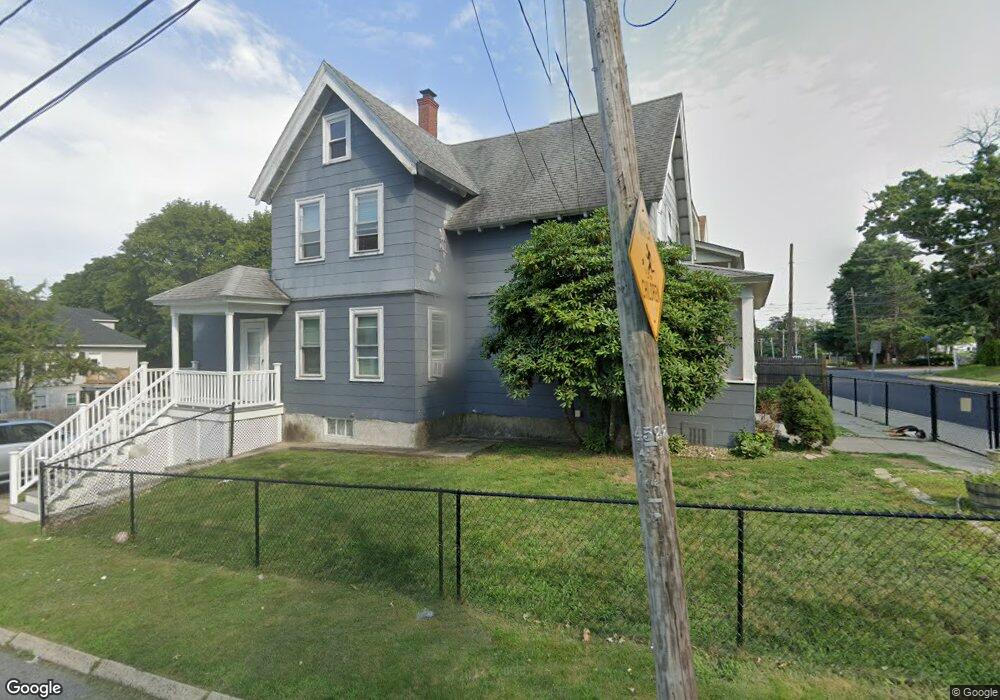
159 Ferry St Lawrence, MA 01841
Prospect Hill-Back Bay NeighborhoodEstimated Value: $492,870 - $596,000
3
Beds
1
Bath
1,703
Sq Ft
$314/Sq Ft
Est. Value
About This Home
This home is located at 159 Ferry St, Lawrence, MA 01841 and is currently estimated at $535,218, approximately $314 per square foot. 159 Ferry St is a home located in Essex County with nearby schools including School For Exceptional Studies, Community Day Charter Public School - Gateway, and Esperanza Academy School of Hope.
Ownership History
Date
Name
Owned For
Owner Type
Purchase Details
Closed on
Nov 30, 2011
Sold by
Est Larivee Eileen E and Larivee James M
Bought by
Monroy Luz
Current Estimated Value
Home Financials for this Owner
Home Financials are based on the most recent Mortgage that was taken out on this home.
Original Mortgage
$128,250
Outstanding Balance
$88,110
Interest Rate
4.1%
Mortgage Type
Purchase Money Mortgage
Estimated Equity
$447,108
Create a Home Valuation Report for This Property
The Home Valuation Report is an in-depth analysis detailing your home's value as well as a comparison with similar homes in the area
Home Values in the Area
Average Home Value in this Area
Purchase History
| Date | Buyer | Sale Price | Title Company |
|---|---|---|---|
| Monroy Luz | $135,000 | -- |
Source: Public Records
Mortgage History
| Date | Status | Borrower | Loan Amount |
|---|---|---|---|
| Open | Monroy Luz | $128,250 |
Source: Public Records
Tax History
| Year | Tax Paid | Tax Assessment Tax Assessment Total Assessment is a certain percentage of the fair market value that is determined by local assessors to be the total taxable value of land and additions on the property. | Land | Improvement |
|---|---|---|---|---|
| 2025 | $3,612 | $410,400 | $152,900 | $257,500 |
| 2024 | $3,173 | $343,000 | $132,300 | $210,700 |
| 2023 | $3,469 | $341,400 | $132,300 | $209,100 |
| 2022 | $3,177 | $277,700 | $118,000 | $159,700 |
| 2021 | $3,108 | $253,300 | $118,000 | $135,300 |
| 2020 | $3,126 | $251,500 | $116,200 | $135,300 |
| 2019 | $2,938 | $214,800 | $92,800 | $122,000 |
| 2018 | $2,714 | $189,500 | $88,600 | $100,900 |
| 2017 | $2,620 | $170,800 | $81,700 | $89,100 |
| 2016 | $2,530 | $163,100 | $73,100 | $90,000 |
| 2015 | $2,244 | $148,400 | $58,400 | $90,000 |
Source: Public Records
Map
Nearby Homes
- 106 Leroy Ave
- 2 Leslie St
- 264 E Haverhill St Unit 2
- 39 Swan Ave
- 32 Josephine Ave
- 14 Court St
- 18 Erhardt Terrace
- 12 Annette St
- 7 Erhardt Terrace
- 5 Kendrick St
- 192 Union St
- 80-82 Haverhill St
- 25-27 Bicknell Ave
- 89 Newbury St Unit 89B
- 27 Woodland Ct
- 91 Summer St Unit 2
- 52 Howard St
- 1 Riverview Blvd Unit 8-203
- 68 Ashford St
- 7 Stevens Ct
Your Personal Tour Guide
Ask me questions while you tour the home.