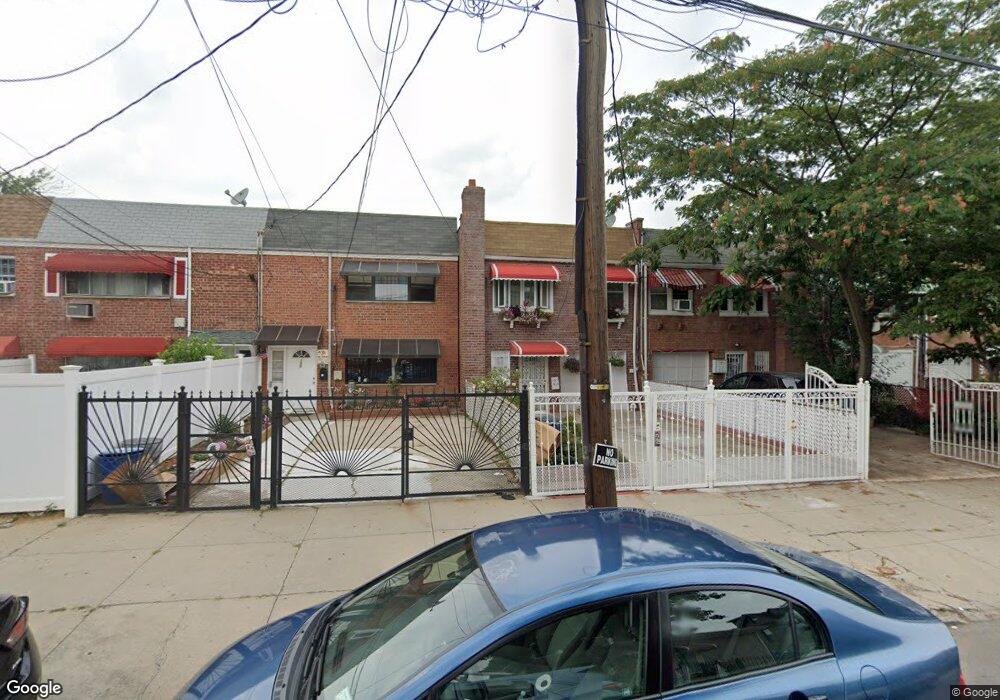
159 Glen St Brooklyn, NY 11208
East New York NeighborhoodEstimated Value: $601,520 - $922,000
Studio
--
Bath
1,600
Sq Ft
$512/Sq Ft
Est. Value
About This Home
This home is located at 159 Glen St, Brooklyn, NY 11208 and is currently estimated at $818,880, approximately $511 per square foot. 159 Glen St is a home located in Kings County with nearby schools including P.S. 214 - Michael Friedsam, Cypress Hills Ascend Charter Lower School, and Blessed Sacrament School.
Ownership History
Date
Name
Owned For
Owner Type
Purchase Details
Closed on
Jan 7, 2004
Sold by
Chambers Erika and Chambers Jayson
Bought by
Chambers Elena and Chambers Jayson
Current Estimated Value
Purchase Details
Closed on
Oct 18, 1999
Sold by
Morales Nicolas
Bought by
Chambers Jason and Chambers Erika
Home Financials for this Owner
Home Financials are based on the most recent Mortgage that was taken out on this home.
Original Mortgage
$167,600
Interest Rate
7.84%
Mortgage Type
FHA
Create a Home Valuation Report for This Property
The Home Valuation Report is an in-depth analysis detailing your home's value as well as a comparison with similar homes in the area
Home Values in the Area
Average Home Value in this Area
Purchase History
| Date | Buyer | Sale Price | Title Company |
|---|---|---|---|
| Chambers Elena | -- | -- | |
| Chambers Elena | -- | -- | |
| Chambers Jason | $169,000 | Washington Title Insurance C | |
| Chambers Jason | $169,000 | Washington Title Insurance C |
Source: Public Records
Mortgage History
| Date | Status | Borrower | Loan Amount |
|---|---|---|---|
| Previous Owner | Chambers Jason | $167,600 |
Source: Public Records
Tax History
| Year | Tax Paid | Tax Assessment Tax Assessment Total Assessment is a certain percentage of the fair market value that is determined by local assessors to be the total taxable value of land and additions on the property. | Land | Improvement |
|---|---|---|---|---|
| 2025 | $5,837 | $34,740 | $12,780 | $21,960 |
| 2024 | $5,837 | $34,560 | $12,780 | $21,780 |
| 2023 | $5,894 | $36,960 | $12,780 | $24,180 |
| 2022 | $5,625 | $30,240 | $12,780 | $17,460 |
| 2021 | $5,594 | $26,580 | $12,780 | $13,800 |
| 2020 | $2,685 | $32,220 | $12,780 | $19,440 |
| 2019 | $5,066 | $35,640 | $12,780 | $22,860 |
| 2018 | $4,930 | $24,184 | $8,268 | $15,916 |
| 2017 | $4,899 | $24,033 | $10,238 | $13,795 |
| 2016 | $4,533 | $22,674 | $11,837 | $10,837 |
| 2015 | $2,515 | $21,392 | $12,868 | $8,524 |
| 2014 | $2,515 | $20,182 | $13,904 | $6,278 |
Source: Public Records
Map
Nearby Homes
Your Personal Tour Guide
Ask me questions while you tour the home.