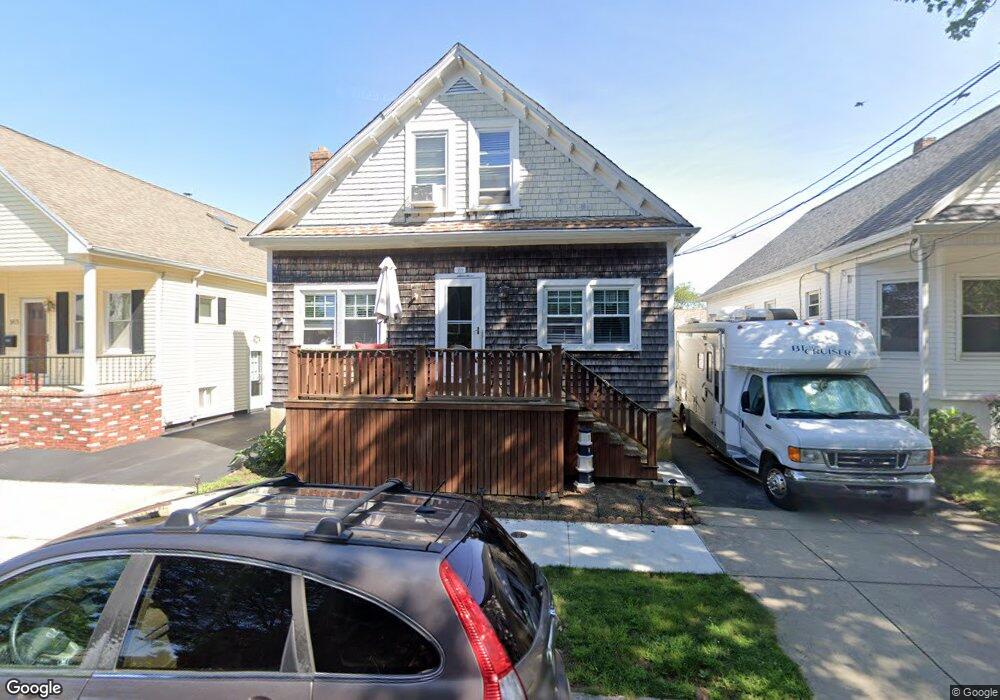
159 Hudson St New Bedford, MA 02744
The South End NeighborhoodEstimated Value: $397,000 - $505,000
4
Beds
2
Baths
1,485
Sq Ft
$303/Sq Ft
Est. Value
About This Home
This home is located at 159 Hudson St, New Bedford, MA 02744 and is currently estimated at $449,809, approximately $302 per square foot. 159 Hudson St is a home located in Bristol County with nearby schools including William H. Taylor Elementary School, Roosevelt Middle School, and New Bedford High School.
Ownership History
Date
Name
Owned For
Owner Type
Purchase Details
Closed on
Jul 8, 2025
Sold by
Kabala Tommy and Kabala Tami A
Bought by
Tommy & Tami A Kabala Irt and Kabala
Current Estimated Value
Purchase Details
Closed on
Jun 21, 1993
Sold by
Jakusik William S and Jakusik Jocye A
Bought by
Kahala Tommy and Kahala Tami A
Home Financials for this Owner
Home Financials are based on the most recent Mortgage that was taken out on this home.
Original Mortgage
$96,150
Interest Rate
7.38%
Mortgage Type
Purchase Money Mortgage
Create a Home Valuation Report for This Property
The Home Valuation Report is an in-depth analysis detailing your home's value as well as a comparison with similar homes in the area
Home Values in the Area
Average Home Value in this Area
Purchase History
| Date | Buyer | Sale Price | Title Company |
|---|---|---|---|
| Tommy & Tami A Kabala Irt | -- | -- | |
| Tommy & Tami A Kabala Irt | -- | -- | |
| Kahala Tommy | $95,000 | -- | |
| Kahala Tommy | $95,000 | -- |
Source: Public Records
Mortgage History
| Date | Status | Borrower | Loan Amount |
|---|---|---|---|
| Previous Owner | Kahala Tommy | $50,000 | |
| Previous Owner | Kahala Tommy | $94,900 | |
| Previous Owner | Kahala Tommy | $96,150 |
Source: Public Records
Tax History Compared to Growth
Tax History
| Year | Tax Paid | Tax Assessment Tax Assessment Total Assessment is a certain percentage of the fair market value that is determined by local assessors to be the total taxable value of land and additions on the property. | Land | Improvement |
|---|---|---|---|---|
| 2025 | $3,970 | $351,000 | $110,700 | $240,300 |
| 2024 | $3,749 | $312,400 | $104,300 | $208,100 |
| 2023 | $3,850 | $269,400 | $89,800 | $179,600 |
| 2022 | $3,501 | $225,300 | $81,800 | $143,500 |
| 2021 | $10,594 | $218,000 | $81,800 | $136,200 |
| 2020 | $4,914 | $214,700 | $81,800 | $132,900 |
| 2019 | $3,664 | $200,200 | $81,800 | $118,400 |
| 2018 | $3,150 | $189,400 | $81,800 | $107,600 |
| 2017 | $2,972 | $178,100 | $81,800 | $96,300 |
| 2016 | $2,805 | $170,100 | $78,600 | $91,500 |
| 2015 | $2,520 | $160,200 | $73,800 | $86,400 |
| 2014 | $2,274 | $150,000 | $73,800 | $76,200 |
Source: Public Records
Map
Nearby Homes