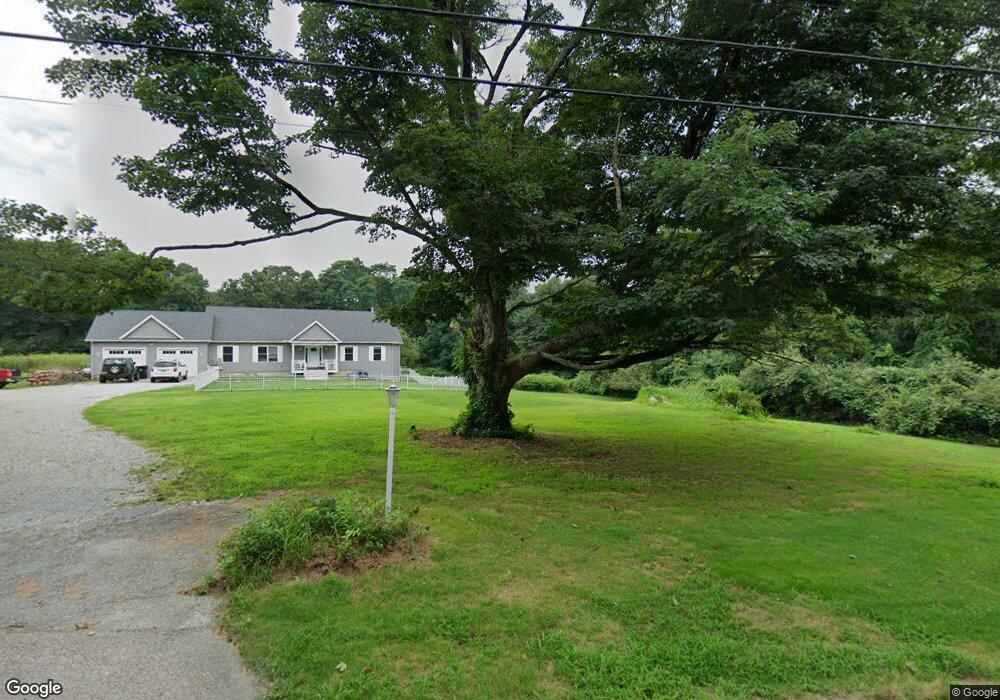
159 Kendall Rd Lisbon, CT 06351
Estimated Value: $415,000 - $496,629
3
Beds
2
Baths
1,832
Sq Ft
$242/Sq Ft
Est. Value
About This Home
This home is located at 159 Kendall Rd, Lisbon, CT 06351 and is currently estimated at $443,657, approximately $242 per square foot. 159 Kendall Rd is a home located in New London County with nearby schools including Lisbon Central School, Sacred Heart School, and St. Joseph Elementary School.
Ownership History
Date
Name
Owned For
Owner Type
Purchase Details
Closed on
Jun 28, 2021
Sold by
Frazer Tuohy J and Tuohy Jennifer L
Bought by
Tuohy Jennifer L and Tuohy Louis A
Current Estimated Value
Home Financials for this Owner
Home Financials are based on the most recent Mortgage that was taken out on this home.
Original Mortgage
$320,000
Outstanding Balance
$287,184
Interest Rate
2.9%
Mortgage Type
New Conventional
Estimated Equity
$156,473
Purchase Details
Closed on
Oct 5, 2020
Sold by
Frazer Dayna
Bought by
Frazer Jennifer
Purchase Details
Closed on
Oct 7, 2013
Sold by
Frazer James D and Frazer Joan M
Bought by
Frazer Dayna M and Frazer-Tuohy Jennifer L
Purchase Details
Closed on
Oct 18, 2004
Sold by
Frazer James
Bought by
Frazer James and Frazer Marie Joan
Home Financials for this Owner
Home Financials are based on the most recent Mortgage that was taken out on this home.
Original Mortgage
$120,800
Interest Rate
5.8%
Mortgage Type
Purchase Money Mortgage
Create a Home Valuation Report for This Property
The Home Valuation Report is an in-depth analysis detailing your home's value as well as a comparison with similar homes in the area
Home Values in the Area
Average Home Value in this Area
Purchase History
| Date | Buyer | Sale Price | Title Company |
|---|---|---|---|
| Tuohy Jennifer L | -- | None Available | |
| Tuohy Jennifer L | -- | None Available | |
| Frazer Jennifer | -- | None Available | |
| Frazer Jennifer | -- | None Available | |
| Frazer Dayna M | -- | -- | |
| Frazer James | $103,000 | -- | |
| Frazer Dayna M | -- | -- | |
| Frazer James | $103,000 | -- |
Source: Public Records
Mortgage History
| Date | Status | Borrower | Loan Amount |
|---|---|---|---|
| Open | Tuohy Jennifer L | $320,000 | |
| Closed | Tuohy Jennifer L | $320,000 | |
| Previous Owner | Frazer James | $120,800 |
Source: Public Records
Tax History
| Year | Tax Paid | Tax Assessment Tax Assessment Total Assessment is a certain percentage of the fair market value that is determined by local assessors to be the total taxable value of land and additions on the property. | Land | Improvement |
|---|---|---|---|---|
| 2025 | $7,407 | $277,420 | $45,290 | $232,130 |
| 2024 | $7,055 | $277,420 | $45,290 | $232,130 |
| 2023 | $6,500 | $277,420 | $45,290 | $232,130 |
| 2022 | $5,164 | $232,300 | $45,290 | $187,010 |
| 2021 | $3,502 | $58,240 | $47,740 | $10,500 |
| 2020 | $1,353 | $58,240 | $47,740 | $10,500 |
| 2019 | $3,455 | $58,240 | $47,740 | $10,500 |
| 2018 | $2,263 | $100,560 | $47,740 | $52,820 |
| 2017 | $2,263 | $100,560 | $47,740 | $52,820 |
| 2014 | $2,162 | $110,860 | $0 | $0 |
Source: Public Records
Map
Nearby Homes
- 23 Versailles Rd
- 30 Riverside Dr
- 220 Preston Allen Rd
- 91 Taftville Occum Rd
- 513 Canterbury Turnpike
- 119 Taftville Occum Rd
- 112 Victorian Dr
- 282-318R Old Canterbury Turnpike
- 245 Old Canterbury Turnpike Unit Lot A
- 245 Old Canterbury Turnpike Unit Lot B
- 5 Atlantic Ave
- 5 Town House Rd
- 252 Old Canterbury Turnpike Unit LOT 94
- 252 Old Canterbury Turnpike Unit LOT 33
- 244 Taftville Occum Rd
- 17 NeMcZuk Dr
- 2 N A St
- 22 N A St
- 99 Old Canterbury Turnpike
- 133 Providence St
- 147 Kendall Rd
- 154 Kendall Rd
- 162 Kendall Rd
- 146 Kendall Rd
- 177 Kendall Rd
- 217 Preston Allen Rd
- 219 Preston Allen Rd
- 174 Kendall Rd
- 197 Preston Allen Rd
- 212 Preston Allen Rd
- 206 Preston Allen Rd
- 227 Preston Allen Rd
- 214 Preston Allen Rd
- 202 Preston Allen Rd
- 184 Preston Allen Rd
- 218 Preston Allen Rd
- 28 McNeeley Rd
- 178 Preston Allen Rd
- 22 McNeeley Rd
- 185 Kendall Rd
Your Personal Tour Guide
Ask me questions while you tour the home.