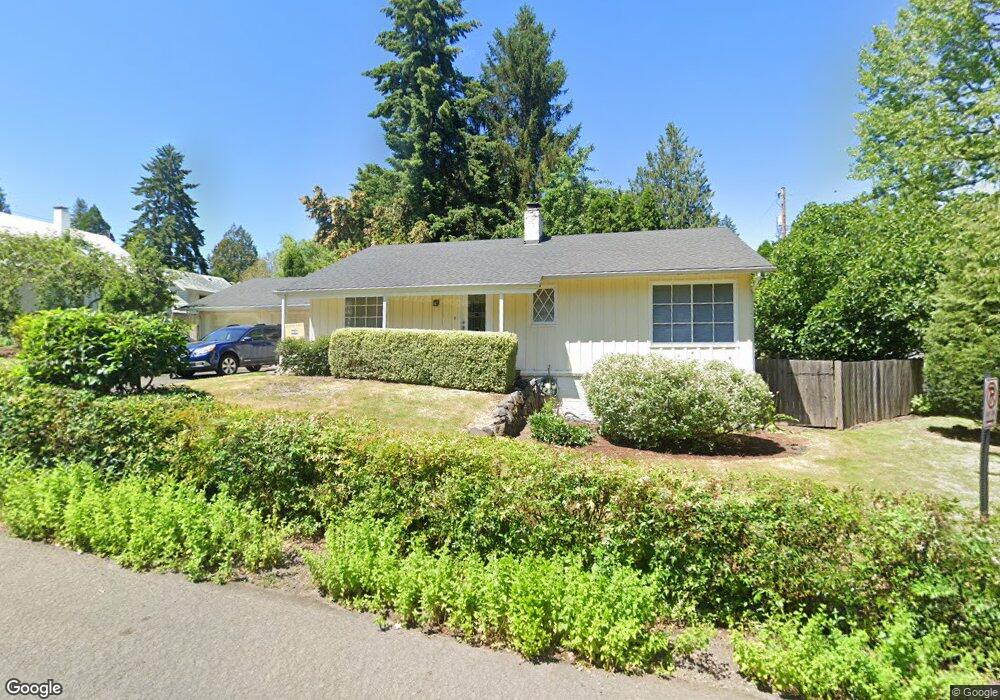
159 Ladd St Lake Oswego, OR 97034
Foothills NeighborhoodEstimated Value: $896,000 - $1,398,000
3
Beds
2
Baths
2,824
Sq Ft
$401/Sq Ft
Est. Value
About This Home
This home is located at 159 Ladd St, Lake Oswego, OR 97034 and is currently estimated at $1,132,085, approximately $400 per square foot. 159 Ladd St is a home located in Clackamas County with nearby schools including Hallinan Elementary School, Lakeridge Middle School, and Lakeridge High School.
Ownership History
Date
Name
Owned For
Owner Type
Purchase Details
Closed on
Feb 25, 2004
Sold by
Nash Anthony N and Nash Amy B
Bought by
Fischer Sonya
Current Estimated Value
Home Financials for this Owner
Home Financials are based on the most recent Mortgage that was taken out on this home.
Original Mortgage
$260,000
Outstanding Balance
$112,521
Interest Rate
4.62%
Mortgage Type
Unknown
Estimated Equity
$1,019,564
Purchase Details
Closed on
May 31, 2002
Sold by
Roberts Vicki J
Bought by
Nash Anthony N and Nash Amy B
Home Financials for this Owner
Home Financials are based on the most recent Mortgage that was taken out on this home.
Original Mortgage
$186,400
Interest Rate
6.89%
Purchase Details
Closed on
Oct 6, 1999
Sold by
Vanhandel Peter
Bought by
Roberts Vicki J
Purchase Details
Closed on
May 3, 1995
Sold by
Shaar Sandra A and Kirton Sandra Shaar
Bought by
Vanhandel Peter
Home Financials for this Owner
Home Financials are based on the most recent Mortgage that was taken out on this home.
Original Mortgage
$26,000
Interest Rate
8.51%
Create a Home Valuation Report for This Property
The Home Valuation Report is an in-depth analysis detailing your home's value as well as a comparison with similar homes in the area
Home Values in the Area
Average Home Value in this Area
Purchase History
| Date | Buyer | Sale Price | Title Company |
|---|---|---|---|
| Fischer Sonya | $325,000 | Ticor Title Insurance Compan | |
| Nash Anthony N | $233,000 | First American | |
| Roberts Vicki J | $217,016 | First American | |
| Vanhandel Peter | $1,500 | -- |
Source: Public Records
Mortgage History
| Date | Status | Borrower | Loan Amount |
|---|---|---|---|
| Open | Fischer Sonya | $260,000 | |
| Previous Owner | Nash Anthony N | $186,400 | |
| Previous Owner | Vanhandel Peter | $26,000 | |
| Closed | Nash Anthony N | $23,300 | |
| Closed | Fischer Sonya | $32,500 |
Source: Public Records
Tax History Compared to Growth
Tax History
| Year | Tax Paid | Tax Assessment Tax Assessment Total Assessment is a certain percentage of the fair market value that is determined by local assessors to be the total taxable value of land and additions on the property. | Land | Improvement |
|---|---|---|---|---|
| 2024 | $8,698 | $452,779 | -- | -- |
| 2023 | $8,698 | $439,592 | $0 | $0 |
| 2022 | $8,192 | $426,789 | $0 | $0 |
| 2021 | $7,566 | $414,359 | $0 | $0 |
| 2020 | $7,376 | $402,291 | $0 | $0 |
| 2019 | $7,194 | $390,574 | $0 | $0 |
| 2018 | $6,841 | $379,198 | $0 | $0 |
| 2017 | $6,601 | $368,153 | $0 | $0 |
| 2016 | $6,009 | $357,430 | $0 | $0 |
| 2015 | $5,805 | $347,019 | $0 | $0 |
| 2014 | $5,730 | $336,912 | $0 | $0 |
Source: Public Records
Map
Nearby Homes
- 420 S State St
- 196 Ridgeway Rd
- 115 Ash St
- 246 Ridgeway Rd
- 128 Northshore Rd
- 668 Mcvey Ave Unit 36
- 668 Mcvey Ave Unit 83
- 990 Lund St
- 272 Greenwood Rd
- 15498 SE River Forest Dr
- 408 Ridgeway Rd
- 411 Ridgeway Rd
- 524 Ridgeway Rd
- 161 3rd St
- 1261 Wells St
- 818 Ash St
- 589 Ridgeway Rd
- 5051 Foothills Dr Unit E
- 630 Ridgeway Rd
- 15323 SE Fairoaks Ave