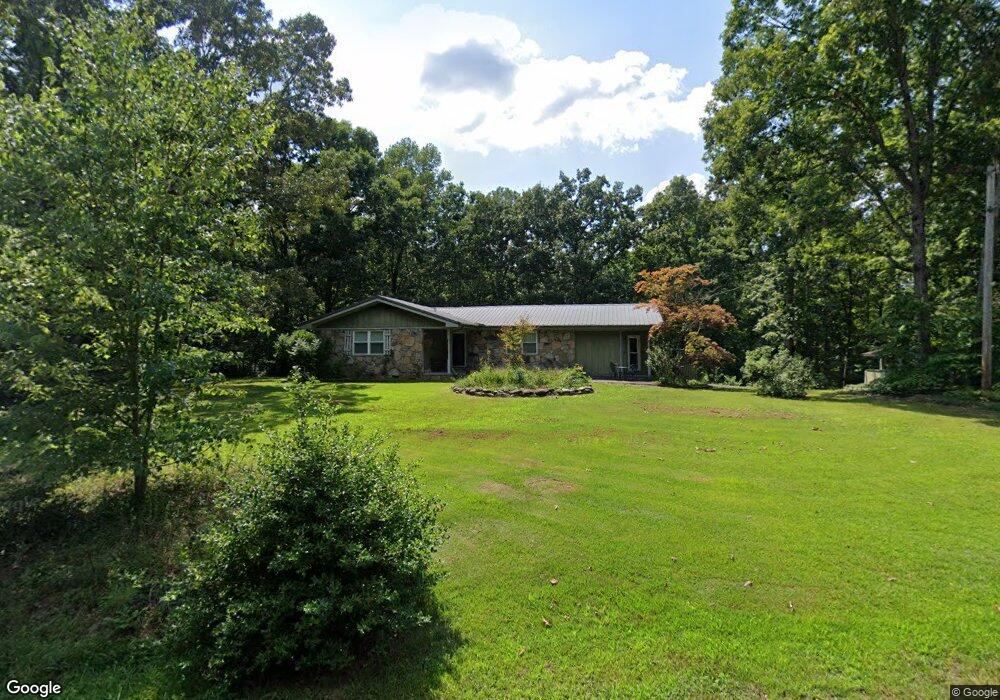
159 Leon Cir Chatsworth, GA 30705
Estimated Value: $253,226 - $331,000
--
Bed
2
Baths
1,564
Sq Ft
$184/Sq Ft
Est. Value
About This Home
This home is located at 159 Leon Cir, Chatsworth, GA 30705 and is currently estimated at $287,557, approximately $183 per square foot. 159 Leon Cir is a home located in Murray County with nearby schools including Woodlawn Elementary School, Bagley Middle School, and North Murray High School.
Ownership History
Date
Name
Owned For
Owner Type
Purchase Details
Closed on
Feb 21, 2025
Sold by
Goss Nicholas Elliot
Bought by
Dobbins John Charles and Dobbins Toby
Current Estimated Value
Home Financials for this Owner
Home Financials are based on the most recent Mortgage that was taken out on this home.
Original Mortgage
$270,000
Outstanding Balance
$269,777
Interest Rate
6.96%
Mortgage Type
VA
Estimated Equity
$17,780
Purchase Details
Closed on
Feb 10, 2023
Sold by
Goss Eddie Roger
Bought by
Southerland Carrie Ann and Goss Ginge Ross
Purchase Details
Closed on
Dec 20, 2019
Sold by
Goss Vicki Lynn
Bought by
Goss Eddie Roger
Purchase Details
Closed on
Nov 14, 2000
Sold by
Pierce Cletus H
Bought by
Goss Eddie R
Purchase Details
Closed on
Nov 10, 2000
Sold by
Francis Walter A
Bought by
Pierce Cletus H
Purchase Details
Closed on
Jul 27, 1994
Bought by
Francis Walter A
Create a Home Valuation Report for This Property
The Home Valuation Report is an in-depth analysis detailing your home's value as well as a comparison with similar homes in the area
Home Values in the Area
Average Home Value in this Area
Purchase History
| Date | Buyer | Sale Price | Title Company |
|---|---|---|---|
| Dobbins John Charles | $270,000 | -- | |
| Southerland Carrie Ann | -- | -- | |
| Goss Eddie Roger | -- | -- | |
| Goss Eddie R | $103,500 | -- | |
| Pierce Cletus H | $80,000 | -- | |
| Francis Walter A | $76,000 | -- |
Source: Public Records
Mortgage History
| Date | Status | Borrower | Loan Amount |
|---|---|---|---|
| Open | Dobbins John Charles | $270,000 | |
| Previous Owner | Goss Eddie R | $20,000 |
Source: Public Records
Tax History Compared to Growth
Tax History
| Year | Tax Paid | Tax Assessment Tax Assessment Total Assessment is a certain percentage of the fair market value that is determined by local assessors to be the total taxable value of land and additions on the property. | Land | Improvement |
|---|---|---|---|---|
| 2024 | $1,750 | $74,428 | $6,880 | $67,548 |
| 2023 | $248 | $77,632 | $6,880 | $70,752 |
| 2022 | $248 | $67,112 | $6,560 | $60,552 |
| 2021 | $945 | $54,312 | $6,560 | $47,752 |
| 2020 | $945 | $45,272 | $6,240 | $39,032 |
| 2019 | $949 | $45,272 | $6,240 | $39,032 |
| 2018 | $949 | $45,272 | $6,240 | $39,032 |
| 2017 | $0 | $40,072 | $6,240 | $33,832 |
| 2016 | $842 | $39,116 | $10,120 | $28,996 |
| 2015 | -- | $39,116 | $10,120 | $28,996 |
| 2014 | -- | $39,116 | $10,120 | $28,996 |
| 2013 | -- | $39,116 | $10,120 | $28,996 |
Source: Public Records
Map
Nearby Homes
- 0 Leon Cir
- 210 Gordon Dr
- 156 Goldsmith Ln
- 0 Old Free Hope Rd
- 185 Cedar Ridge Rd SE
- 543 Callie Jones Rd
- 741 North Dr SE
- 8011 Starr Dr SE
- 279 Satterfield Rd SE
- 162 Alcoa Dr
- 404 Lakeview Dr SE
- 4386 Tibbs Bridge Rd SE
- 247 Robert Jackson Rd
- 0 Cheree Way Unit 129259
- 5111 Mark Brown Rd NE
- 3807 Georgia 52
- 0 Ledford Ave SE
- 1259 Rollins Ketchum Rd
- 0 Rollins Ketchum Rd
- Lt 30-33 Indian Dr NE
- 121 Leon Cir
- 189 Leon Cir
- 90 Conasauga Way
- 176 Leon Cir
- 61 Leon Cir
- 95 Conasauga Way
- TRACT 19 Conasauga Way Unit TRACT 19
- 0 Martha Sue Dr Unit 7091555
- 0 Martha Sue Dr Unit 3246212
- 0 Martha Sue Dr
- 237 Greeson Bend Rd
- 17 Conasauga Way
- 8 Leon Cir
- 147 Greeson Bend Rd
- 5 Leon Cir
- 145 Greeson Bend Rd
- 300 Leon Cir
- 259 Martha Sue Dr
- 371 Martha Sue Dr
- 335 Martha Sue Dr