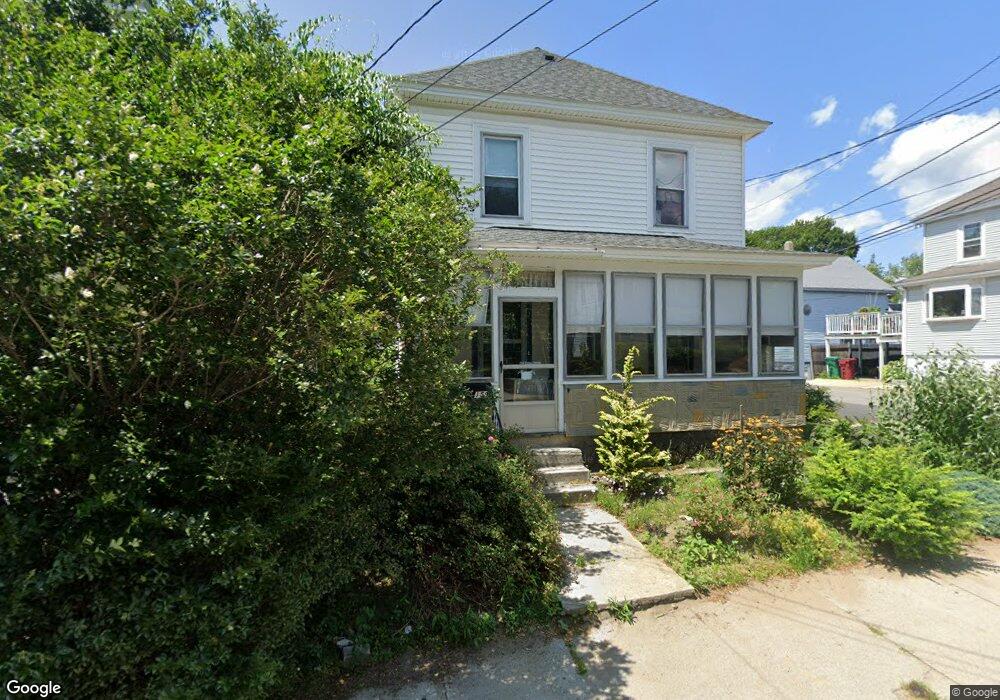
159 Ludlam St Lowell, MA 01850
Centralville NeighborhoodEstimated Value: $395,000 - $439,718
3
Beds
2
Baths
1,482
Sq Ft
$279/Sq Ft
Est. Value
About This Home
This home is located at 159 Ludlam St, Lowell, MA 01850 and is currently estimated at $413,930, approximately $279 per square foot. 159 Ludlam St is a home located in Middlesex County with nearby schools including Greenhalge Elementary School, S. Christa McAuliffe Elementary School, and Moody Elementary School.
Ownership History
Date
Name
Owned For
Owner Type
Purchase Details
Closed on
Oct 24, 2025
Sold by
Paul H Kisly T H and Paul Barnes
Bought by
Lanikai Llc
Current Estimated Value
Home Financials for this Owner
Home Financials are based on the most recent Mortgage that was taken out on this home.
Original Mortgage
$378,750
Outstanding Balance
$286,299
Interest Rate
6.35%
Mortgage Type
Purchase Money Mortgage
Estimated Equity
$127,631
Purchase Details
Closed on
Apr 24, 2025
Sold by
Kisly Paul H
Bought by
Paul H Kisly T H and Paul Kisly
Purchase Details
Closed on
Feb 10, 2005
Sold by
Kisly Pearl A
Bought by
Kisly Paul H and Kisly Pearl A
Purchase Details
Closed on
Aug 10, 1973
Bought by
Kisly Paul H
Create a Home Valuation Report for This Property
The Home Valuation Report is an in-depth analysis detailing your home's value as well as a comparison with similar homes in the area
Home Values in the Area
Average Home Value in this Area
Purchase History
| Date | Buyer | Sale Price | Title Company |
|---|---|---|---|
| Lanikai Llc | $400,000 | -- | |
| Paul H Kisly T H | -- | None Available | |
| Paul H Kisly T H | -- | None Available | |
| Kisly Paul H | -- | -- | |
| Kisly Paul H | -- | -- | |
| Kisly Paul H | -- | -- | |
| Kisly Paul H | -- | -- |
Source: Public Records
Mortgage History
| Date | Status | Borrower | Loan Amount |
|---|---|---|---|
| Open | Lanikai Llc | $378,750 |
Source: Public Records
Tax History
| Year | Tax Paid | Tax Assessment Tax Assessment Total Assessment is a certain percentage of the fair market value that is determined by local assessors to be the total taxable value of land and additions on the property. | Land | Improvement |
|---|---|---|---|---|
| 2025 | $4,181 | $364,200 | $144,400 | $219,800 |
| 2024 | $4,178 | $350,800 | $143,500 | $207,300 |
| 2023 | $3,922 | $315,800 | $124,800 | $191,000 |
| 2022 | $3,661 | $288,500 | $113,400 | $175,100 |
| 2021 | $3,417 | $253,900 | $98,700 | $155,200 |
| 2020 | $3,054 | $228,600 | $81,100 | $147,500 |
| 2019 | $2,708 | $192,900 | $65,100 | $127,800 |
| 2018 | $2,652 | $184,300 | $62,100 | $122,200 |
| 2017 | $2,678 | $179,500 | $48,600 | $130,900 |
| 2016 | $2,609 | $172,100 | $52,200 | $119,900 |
| 2015 | $2,528 | $163,300 | $52,200 | $111,100 |
| 2013 | $2,528 | $168,400 | $69,800 | $98,600 |
Source: Public Records
Map
Nearby Homes
- 15 Dana St
- 345 Hildreth St Unit 14
- 367 Hildreth St Unit 14
- 417 Hildreth St Unit 30
- 26 Farmland Rd Unit C
- 23 18th St
- 35 Whitney Ave Unit 33
- 27 Bunker Hill Ave
- 18 May St
- 99 W 6th St
- 106 Methuen St Unit B
- 16 Peabody Ave
- 175 Willard St Unit 9
- 52 Lawrence Dr Unit 206
- 551 Hildreth St Unit 10
- 45 W 4th St
- 75 Sladen St
- 174 River Rd
- 700 Robbins Ave Unit 6
- 668 Robbins Ave Unit 1
Your Personal Tour Guide
Ask me questions while you tour the home.