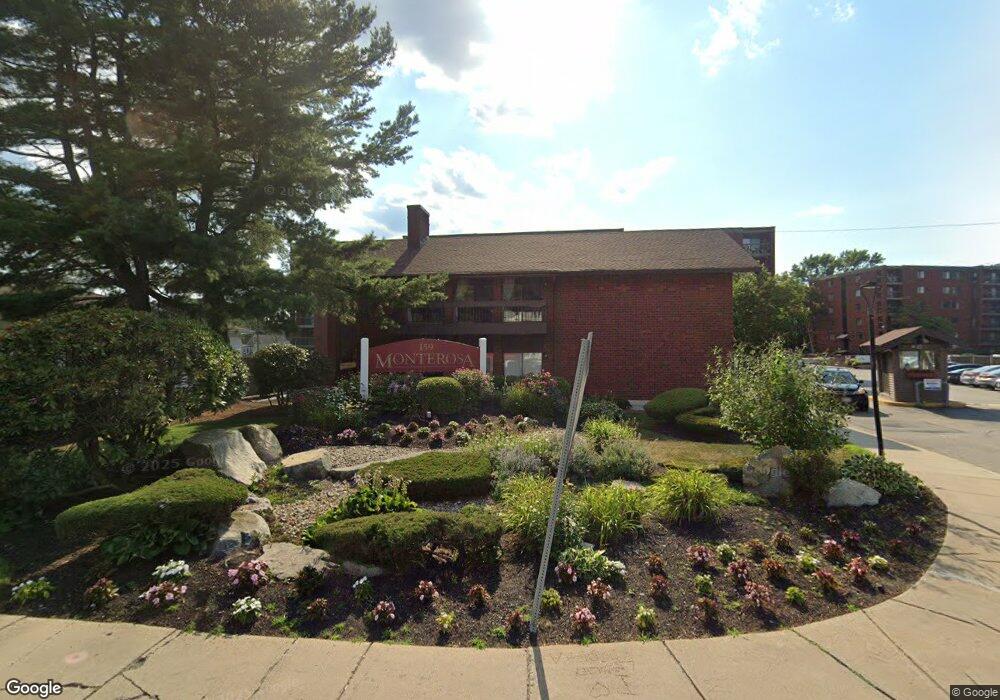
159 Main St, Unit 58C Stoneham, MA 02180
Lindenwood NeighborhoodEstimated Value: $440,351 - $470,000
2
Beds
2
Baths
1,050
Sq Ft
$438/Sq Ft
Est. Value
About This Home
This home is located at 159 Main St Unit 58C, Stoneham, MA 02180 and is currently estimated at $459,838, approximately $437 per square foot. 159 Main St Unit 58C is a home located in Middlesex County with nearby schools including Stoneham High School, St. Patrick Elementary School, and St Joseph School.
Ownership History
Date
Name
Owned For
Owner Type
Purchase Details
Closed on
Dec 13, 2021
Sold by
Sheila E Darrigo Irt and Darrigo
Bought by
Darrigo Sheila E
Current Estimated Value
Home Financials for this Owner
Home Financials are based on the most recent Mortgage that was taken out on this home.
Original Mortgage
$125,000
Outstanding Balance
$114,766
Interest Rate
2.98%
Mortgage Type
Stand Alone Refi Refinance Of Original Loan
Estimated Equity
$345,072
Purchase Details
Closed on
Oct 20, 2020
Sold by
Darrigo 2016 Ft and Darrigo
Bought by
Sheila E Darrigo Irt and Darrigo
Purchase Details
Closed on
Aug 22, 2016
Sold by
Darrigo Patrick and Darrigo Sheila E
Bought by
Darrigo Ft and Darrigo
Purchase Details
Closed on
May 30, 2008
Sold by
Mcphee Cathy M and Roberts Cathy M
Bought by
Darrigo Patrick and Darrigo Sheila
Home Financials for this Owner
Home Financials are based on the most recent Mortgage that was taken out on this home.
Original Mortgage
$125,000
Interest Rate
5.91%
Mortgage Type
Purchase Money Mortgage
Create a Home Valuation Report for This Property
The Home Valuation Report is an in-depth analysis detailing your home's value as well as a comparison with similar homes in the area
Home Values in the Area
Average Home Value in this Area
Purchase History
| Date | Buyer | Sale Price | Title Company |
|---|---|---|---|
| Darrigo Sheila E | -- | None Available | |
| Darrigo Sheila E | -- | None Available | |
| Sheila E Darrigo Irt | -- | None Available | |
| Sheila E Darrigo Irt | -- | None Available | |
| Darrigo Ft | -- | -- | |
| Darrigo Ft | -- | -- | |
| Darrigo Patrick | $230,000 | -- | |
| Darrigo Patrick | $230,000 | -- |
Source: Public Records
Mortgage History
| Date | Status | Borrower | Loan Amount |
|---|---|---|---|
| Open | Darrigo Sheila E | $125,000 | |
| Closed | Darrigo Sheila E | $125,000 | |
| Previous Owner | Darrigo Patrick | $125,000 |
Source: Public Records
Tax History
| Year | Tax Paid | Tax Assessment Tax Assessment Total Assessment is a certain percentage of the fair market value that is determined by local assessors to be the total taxable value of land and additions on the property. | Land | Improvement |
|---|---|---|---|---|
| 2025 | $3,819 | $373,300 | $0 | $373,300 |
| 2024 | $3,772 | $356,200 | $0 | $356,200 |
| 2023 | $3,804 | $342,700 | $0 | $342,700 |
| 2022 | $3,475 | $333,800 | $0 | $333,800 |
| 2021 | $3,571 | $330,000 | $0 | $330,000 |
| 2020 | $3,561 | $330,000 | $0 | $330,000 |
| 2019 | $3,458 | $308,200 | $0 | $308,200 |
| 2018 | $2,972 | $253,800 | $0 | $253,800 |
| 2017 | $2,996 | $241,800 | $0 | $241,800 |
| 2016 | $3,066 | $241,400 | $0 | $241,400 |
| 2015 | $2,912 | $224,700 | $0 | $224,700 |
| 2014 | $2,709 | $200,800 | $0 | $200,800 |
Source: Public Records
About This Building
Map
Nearby Homes
- 159 Main St Unit 27C
- 159 Main St Unit 39A
- 8 Steele St
- 98 Main St Unit 2
- 1 Tremont St
- 62 High St Unit Lot 8
- 62 High St Unit 4
- 62 High St Unit Lot 5
- 62 High St Unit Lot 12
- 1 Alden Ave
- 66 Main St Unit 15A
- 12 Isola Ln
- 21 Tremont St Unit B
- 21 Tremont St Unit A
- 64 Main St Unit 24B
- 58 Washington St
- 10 Pomeworth St Unit A
- 8 Common St Unit 3
- 200 Ledgewood Dr Unit 601
- 3 Valley Rd
- 159 Main St
- 159 Main St Unit 1A
- 159 Main St Unit 9C
- 159 Main St Unit 9B
- 159 Main St Unit 9A
- 159 Main St Unit 8C
- 159 Main St Unit 8A
- 159 Main St Unit 7C
- 159 Main St Unit 7B
- 159 Main St Unit 7A
- 159 Main St Unit 6C
- 159 Main St Unit 6B
- 159 Main St Unit 6A
- 159 Main St Unit 5C
- 159 Main St Unit 5B
- 159 Main St Unit 5A
- 159 Main St Unit 59C
- 159 Main St Unit 59B
- 159 Main St Unit 59A
- 159 Main St Unit 58B
Your Personal Tour Guide
Ask me questions while you tour the home.