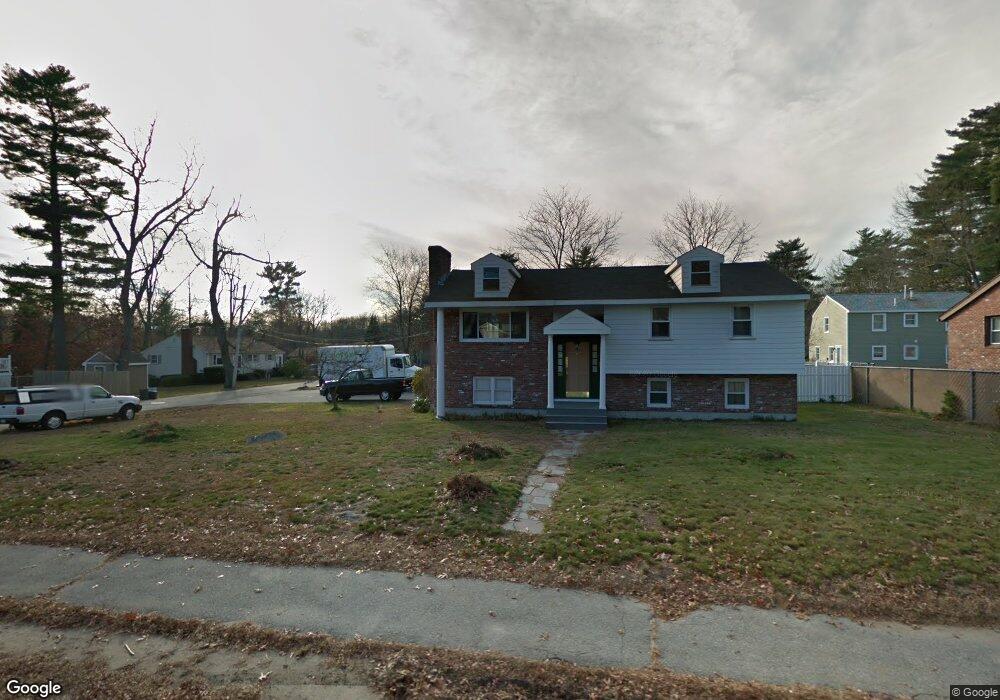
159 Main St Wilmington, MA 01887
Estimated Value: $509,000 - $635,000
3
Beds
1
Bath
1,100
Sq Ft
$519/Sq Ft
Est. Value
About This Home
This home is located at 159 Main St, Wilmington, MA 01887 and is currently estimated at $570,623, approximately $518 per square foot. 159 Main St is a home located in Middlesex County with nearby schools including Wilmington Middle School, Wilmington High School, and Abundant Life Christian School and Childcare.
Ownership History
Date
Name
Owned For
Owner Type
Purchase Details
Closed on
Oct 12, 2011
Sold by
Infantino Joseph and Infantino Mark
Bought by
Infantino Joseph
Current Estimated Value
Purchase Details
Closed on
Aug 9, 2011
Sold by
S & R Rt
Bought by
Infantino Kathleen Est
Purchase Details
Closed on
Oct 28, 2010
Sold by
S & R Rt
Bought by
S & R Rt
Purchase Details
Closed on
May 20, 2010
Sold by
159 Main Street Llc
Bought by
S & R Rt
Home Financials for this Owner
Home Financials are based on the most recent Mortgage that was taken out on this home.
Original Mortgage
$125,000
Interest Rate
5.23%
Mortgage Type
Purchase Money Mortgage
Create a Home Valuation Report for This Property
The Home Valuation Report is an in-depth analysis detailing your home's value as well as a comparison with similar homes in the area
Purchase History
| Date | Buyer | Sale Price | Title Company |
|---|---|---|---|
| Infantino Joseph | -- | -- | |
| Infantino Kathleen Est | -- | -- | |
| S & R Rt | $200,000 | -- | |
| S & R Rt | -- | -- | |
| 159 Main Street Llc | $210,000 | -- |
Source: Public Records
Mortgage History
| Date | Status | Borrower | Loan Amount |
|---|---|---|---|
| Previous Owner | 159 Main Street Llc | $125,000 |
Source: Public Records
Tax History
| Year | Tax Paid | Tax Assessment Tax Assessment Total Assessment is a certain percentage of the fair market value that is determined by local assessors to be the total taxable value of land and additions on the property. | Land | Improvement |
|---|---|---|---|---|
| 2025 | $6,312 | $551,300 | $258,900 | $292,400 |
| 2024 | $6,254 | $547,200 | $258,900 | $288,300 |
| 2023 | $6,043 | $506,100 | $235,300 | $270,800 |
| 2022 | $5,749 | $441,200 | $196,100 | $245,100 |
| 2021 | $5,645 | $407,900 | $178,200 | $229,700 |
| 2020 | $5,934 | $437,000 | $178,200 | $258,800 |
| 2019 | $5,459 | $397,000 | $169,800 | $227,200 |
| 2018 | $5,105 | $354,300 | $161,700 | $192,600 |
| 2017 | $4,903 | $339,300 | $154,000 | $185,300 |
| 2016 | $4,644 | $317,400 | $146,700 | $170,700 |
| 2015 | $4,414 | $307,200 | $146,700 | $160,500 |
| 2014 | $4,150 | $291,400 | $139,700 | $151,700 |
Source: Public Records
Map
Nearby Homes
- 57 Taplin Ave
- 48 Brand Ave
- 46 Cottage St
- 56 Grove Ave
- 111 Grove Ave
- 3 Clark Terrace
- 4 Doane St
- 14 Manning St
- 12 Hamlin Ln
- 35 Oak St
- 15 Mystic Ave
- 6 Patricia Cir
- 220 Burlington Ave
- 51 Valley Rd
- 79 Valley Rd
- 224 Burlington Ave
- 11 Edgeworth St
- 7 Cross St Unit 301
- 7 Cross St Unit 303
- 7 Cross St Unit 205
Your Personal Tour Guide
Ask me questions while you tour the home.