159 N Main St Farmington, UT 84025
Estimated Value: $564,000 - $687,727
3
Beds
1
Bath
2,904
Sq Ft
$219/Sq Ft
Est. Value
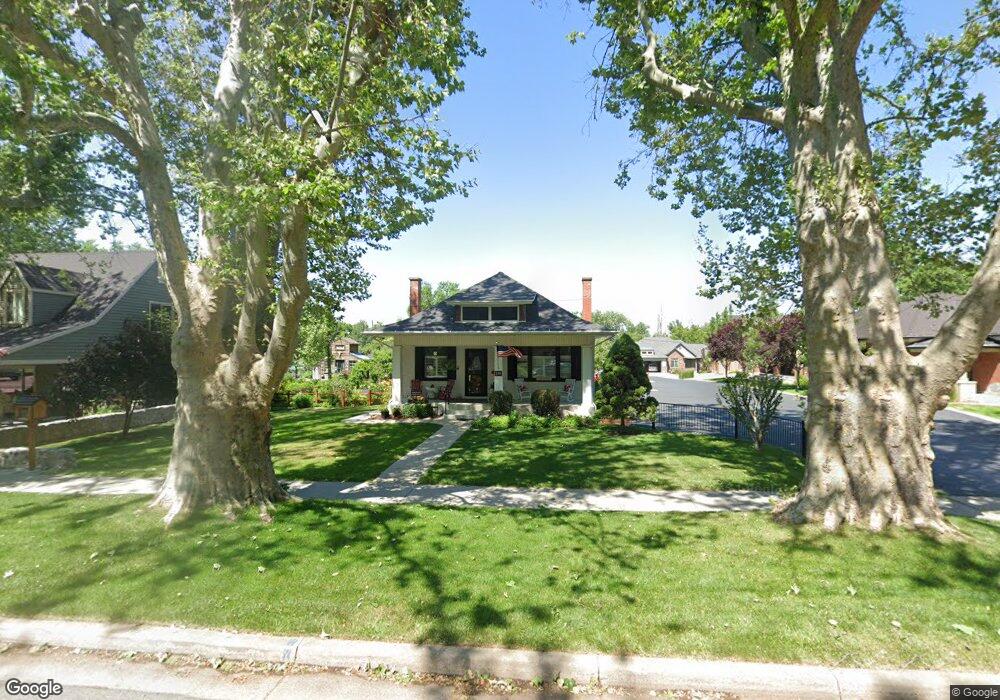
About This Home
This home is located at 159 N Main St, Farmington, UT 84025 and is currently estimated at $635,432, approximately $218 per square foot. 159 N Main St is a home located in Davis County with nearby schools including Farmington Elementary School, Farmington High, and Farmington Junior High School.
Ownership History
Date
Name
Owned For
Owner Type
Purchase Details
Closed on
Sep 14, 2011
Sold by
Spackman Robert Lloyd
Bought by
Kooring John and Kooring Susan W
Current Estimated Value
Home Financials for this Owner
Home Financials are based on the most recent Mortgage that was taken out on this home.
Original Mortgage
$209,407
Outstanding Balance
$144,152
Interest Rate
4.37%
Mortgage Type
VA
Estimated Equity
$491,280
Purchase Details
Closed on
Sep 13, 2011
Sold by
Kooring John and Kooring Susan W
Bought by
Kooring Susan Anne Wortley and The Susan Kooring Trust
Home Financials for this Owner
Home Financials are based on the most recent Mortgage that was taken out on this home.
Original Mortgage
$209,407
Outstanding Balance
$144,152
Interest Rate
4.37%
Mortgage Type
VA
Estimated Equity
$491,280
Purchase Details
Closed on
Mar 6, 1997
Sold by
Spackman Lloyd Thomas
Bought by
Spackman Lloyd Thomas and Lloyd Thomas Spackman Family Trust
Create a Home Valuation Report for This Property
The Home Valuation Report is an in-depth analysis detailing your home's value as well as a comparison with similar homes in the area
Home Values in the Area
Average Home Value in this Area
Purchase History
| Date | Buyer | Sale Price | Title Company |
|---|---|---|---|
| Kooring John | -- | Hickman Land Title C | |
| Spackman Robert Lloyd | -- | Hickman Land Title C | |
| Kooring Susan Anne Wortley | -- | Inwest Title Services | |
| Spackman Lloyd Thomas | -- | -- |
Source: Public Records
Mortgage History
| Date | Status | Borrower | Loan Amount |
|---|---|---|---|
| Open | Kooring John | $209,407 |
Source: Public Records
Tax History Compared to Growth
Tax History
| Year | Tax Paid | Tax Assessment Tax Assessment Total Assessment is a certain percentage of the fair market value that is determined by local assessors to be the total taxable value of land and additions on the property. | Land | Improvement |
|---|---|---|---|---|
| 2024 | $3,020 | $301,949 | $225,736 | $76,213 |
| 2023 | $2,887 | $289,300 | $213,475 | $75,824 |
| 2022 | $2,945 | $554,000 | $384,692 | $169,308 |
| 2021 | $2,824 | $435,000 | $349,620 | $85,380 |
| 2020 | $2,304 | $346,000 | $305,143 | $40,857 |
| 2019 | $2,286 | $333,000 | $266,627 | $66,373 |
| 2018 | $2,132 | $306,000 | $259,465 | $46,535 |
| 2016 | $2,002 | $147,895 | $112,218 | $35,677 |
| 2015 | $1,967 | $137,940 | $112,218 | $25,722 |
| 2014 | $2,014 | $145,123 | $93,515 | $51,608 |
| 2013 | -- | $132,866 | $72,460 | $60,406 |
Source: Public Records
Map
Nearby Homes
- 170 N Main St
- 21 N 100 W Unit 3
- 2 Grayson Way N Unit 11
- 1504 W Kiera Court Ct N Unit 150
- 139 E 400 N
- 69 W Grove Creek Cir
- 38 S 300 W
- 52 N 400 W
- 79 S 300 E
- 292 N Flag Rock Dr
- 372 W Clark Cir
- 1460 W 550 N Unit 166
- 334 E Cottrell Ln
- 13 Sunset Dr
- 434 W 450 S Unit 815
- 250 S 200 W
- 442 W Randys Ct Unit 808
- 554 W Cottle Ln
- 397 W 850 N
- 247 Paulette Way