159 North Bend Way Elgin, IL 60124
Far West Elgin NeighborhoodEstimated Value: $564,925 - $729,000
4
Beds
3
Baths
3,108
Sq Ft
$206/Sq Ft
Est. Value
About This Home
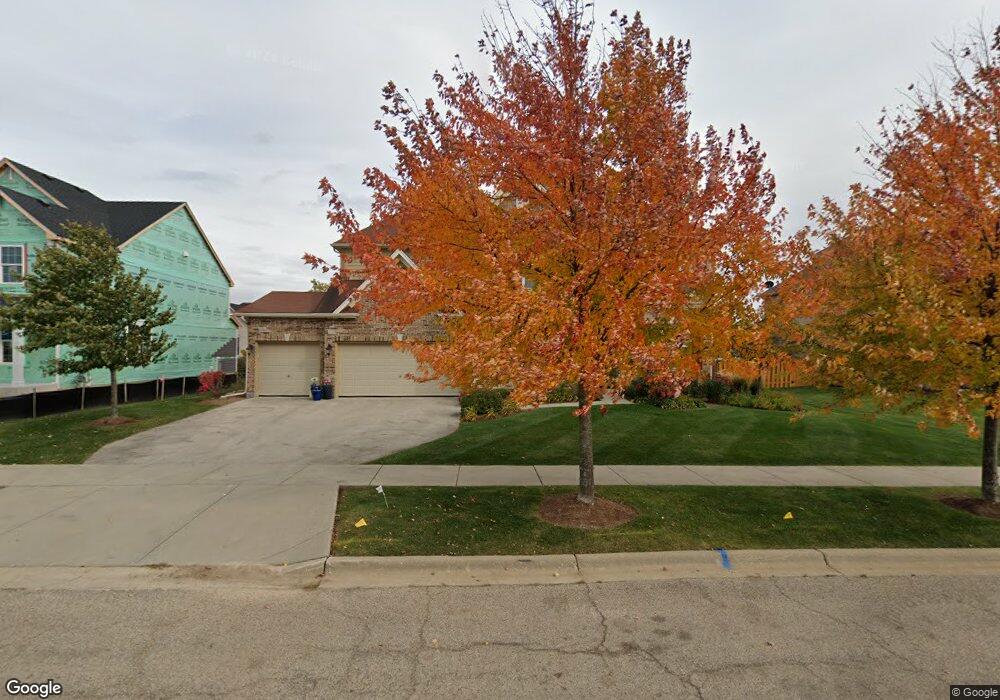
This home is located at 159 North Bend Way, Elgin, IL 60124 and is currently estimated at $641,231, approximately $206 per square foot. 159 North Bend Way is a home with nearby schools including Howard B. Thomas Grade School, Prairie Knolls Middle School, and Central Middle School.
Ownership History
Date
Name
Owned For
Owner Type
Purchase Details
Closed on
Jan 13, 2016
Sold by
Sirin Steven R
Bought by
Sirin Steven R and Steven R Sirin Declaration Of
Current Estimated Value
Purchase Details
Closed on
May 31, 2013
Sold by
Faganel Builders Llc
Bought by
Sirin Steven
Home Financials for this Owner
Home Financials are based on the most recent Mortgage that was taken out on this home.
Original Mortgage
$307,810
Outstanding Balance
$219,056
Interest Rate
3.5%
Mortgage Type
New Conventional
Estimated Equity
$422,175
Purchase Details
Closed on
Sep 4, 2012
Sold by
Tall Paks 47 Llc
Bought by
Faganel Builders Llc
Purchase Details
Closed on
Sep 29, 2010
Sold by
Light Wade B
Bought by
Tall Oaks 47 Llc
Purchase Details
Closed on
Jul 27, 2007
Sold by
Wyndham Deerpoint Homes
Bought by
R A Faganel Builders Inc
Create a Home Valuation Report for This Property
The Home Valuation Report is an in-depth analysis detailing your home's value as well as a comparison with similar homes in the area
Home Values in the Area
Average Home Value in this Area
Purchase History
| Date | Buyer | Sale Price | Title Company |
|---|---|---|---|
| Sirin Steven R | -- | Attorney | |
| Sirin Steven | $385,500 | Chicago Title Insurance Comp | |
| Faganel Builders Llc | $87,000 | Chicago Title Insurance Co | |
| Tall Oaks 47 Llc | -- | Chicago Title Insurance Co | |
| Tall Oaks 47 Llc | $1,175,000 | Chicago Title Insurance Co | |
| R A Faganel Builders Inc | $3,090,000 | Chicago Title Insurance Co |
Source: Public Records
Mortgage History
| Date | Status | Borrower | Loan Amount |
|---|---|---|---|
| Open | Sirin Steven | $307,810 |
Source: Public Records
Tax History
| Year | Tax Paid | Tax Assessment Tax Assessment Total Assessment is a certain percentage of the fair market value that is determined by local assessors to be the total taxable value of land and additions on the property. | Land | Improvement |
|---|---|---|---|---|
| 2024 | $12,874 | $161,835 | $27,638 | $134,197 |
| 2023 | $12,404 | $146,390 | $25,000 | $121,390 |
| 2022 | $11,704 | $134,227 | $21,357 | $112,870 |
| 2021 | $11,741 | $121,236 | $20,633 | $100,603 |
| 2020 | $11,746 | $119,057 | $20,262 | $98,795 |
| 2019 | $11,816 | $117,518 | $20,000 | $97,518 |
| 2018 | $12,484 | $122,638 | $22,771 | $99,867 |
| 2017 | $12,469 | $122,061 | $22,194 | $99,867 |
| 2016 | $13,132 | $119,165 | $21,667 | $97,498 |
| 2015 | -- | $116,698 | $14,747 | $101,951 |
| 2014 | -- | $112,364 | $14,747 | $97,617 |
| 2013 | -- | $61,484 | $1,220 | $60,264 |
Source: Public Records
Map
Nearby Homes
- 3828 Gansett Pkwy
- 218 Middleton Ct
- 193 Trumpet Vine Cir
- 250 Water Lily Ln
- 278 Snow Drop Ln
- 284 Snow Drop Ln
- 291 Snowdrop Ln
- 335 Snowdrop Ln
- 295 Snow Drop Ln
- 315 Snowdrop Ln
- 264 Snowdrop Ln
- 313 Snowdrop Ln
- 268 Snowdrop Ln
- 282 Snowdrop Ln
- 270 Snowdrop Ln
- 272 Snowdrop Ln
- 280 Snowdrop Ln
- 274 Snowdrop Ln
- 3619 Daisy Ln
- 310 Astor Ct
- 157 N Bend Way Dr
- 161 N Bend Way
- 155 N Bend Way
- 155 N Bend Way Unit 151
- 158 Winding Hill Dr
- 156 Winding Hill Dr
- 162 North Bend Way
- 160 Winding Hill Dr
- 160 N Bend Way
- 158 North Bend Way
- 3818 Trillium Trail
- 153 N Bend Way Dr
- 156 N Bend Way
- 154 Winding Hill Dr
- 152 Winding Hill Dr
- 152 North Bend Way
- 3810 Trillium Trail
- 3811 Ivy Ln
- 151 North Bend Way
- 3822 Trillium Trail
Your Personal Tour Guide
Ask me questions while you tour the home.