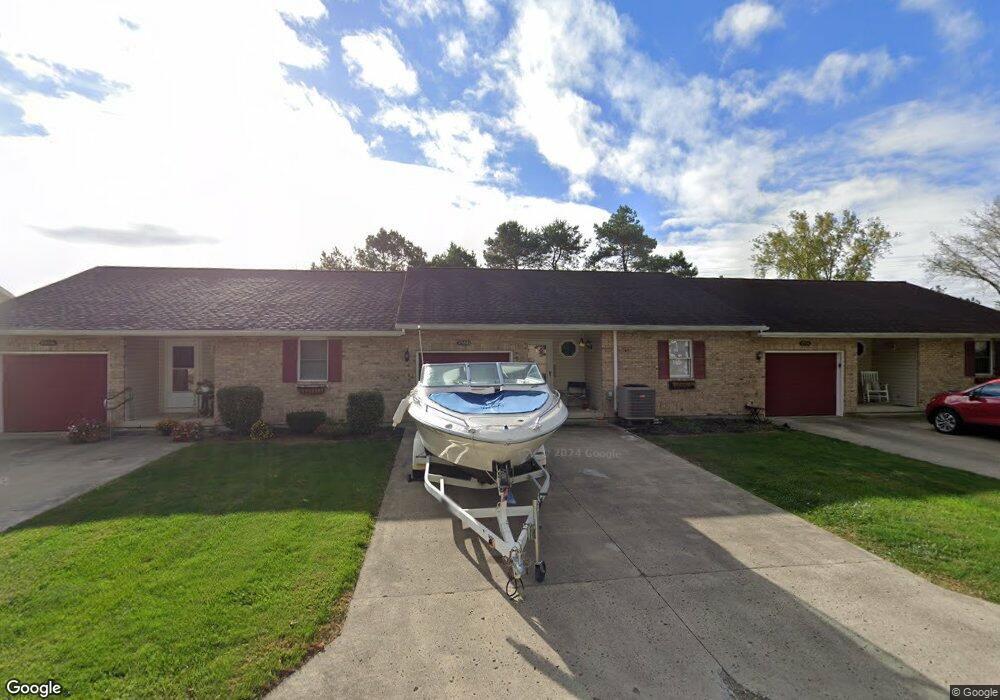
159 Notheana Dr Unit 8 Saint Marys, OH 45885
Estimated Value: $155,000 - $173,000
2
Beds
1
Bath
1,008
Sq Ft
$161/Sq Ft
Est. Value
About This Home
This home is located at 159 Notheana Dr Unit 8, Saint Marys, OH 45885 and is currently estimated at $161,911, approximately $160 per square foot. 159 Notheana Dr Unit 8 is a home located in Auglaize County with nearby schools including St. Mary's West Intermediate School, St. Mary's East Primary School, and St. Marys Middle School.
Ownership History
Date
Name
Owned For
Owner Type
Purchase Details
Closed on
Mar 21, 2025
Sold by
Perin Nicole Lynn and Felver Nicole Lynn
Bought by
Felver Nicole Lynn and Perin Nicole Lynn
Current Estimated Value
Purchase Details
Closed on
Apr 12, 2022
Sold by
Warren Judy C and Warren Douglas W
Bought by
Perin Nicole Lynn
Purchase Details
Closed on
Oct 26, 2020
Sold by
Rieger Richard A
Bought by
Judy C Skeens
Home Financials for this Owner
Home Financials are based on the most recent Mortgage that was taken out on this home.
Interest Rate
2.8%
Purchase Details
Closed on
Nov 8, 2018
Sold by
Burke Susan A and Burke Susan Ann
Bought by
Rieger Richard A and Rieger Jacqueline L
Purchase Details
Closed on
Sep 2, 2003
Bought by
Burke James P
Purchase Details
Closed on
Aug 30, 1999
Bought by
Logan Furniture Partnership
Create a Home Valuation Report for This Property
The Home Valuation Report is an in-depth analysis detailing your home's value as well as a comparison with similar homes in the area
Home Values in the Area
Average Home Value in this Area
Purchase History
| Date | Buyer | Sale Price | Title Company |
|---|---|---|---|
| Felver Nicole Lynn | -- | None Listed On Document | |
| Felver Nicole Lynn | -- | None Listed On Document | |
| Perin Nicole Lynn | -- | Hitchen Kenneth E | |
| Perin Nicole Lynn | -- | None Listed On Document | |
| Judy C Skeens | $124,700 | -- | |
| Rieger Richard A | $109,000 | None Available | |
| Burke James P | $82,000 | -- | |
| Logan Furniture Partnership | $545,800 | -- |
Source: Public Records
Mortgage History
| Date | Status | Borrower | Loan Amount |
|---|---|---|---|
| Previous Owner | Judy C Skeens | -- |
Source: Public Records
Tax History Compared to Growth
Tax History
| Year | Tax Paid | Tax Assessment Tax Assessment Total Assessment is a certain percentage of the fair market value that is determined by local assessors to be the total taxable value of land and additions on the property. | Land | Improvement |
|---|---|---|---|---|
| 2024 | $3,147 | $41,170 | $8,120 | $33,050 |
| 2023 | $1,551 | $41,170 | $8,120 | $33,050 |
| 2022 | $1,343 | $31,420 | $7,060 | $24,360 |
| 2021 | $1,323 | $31,420 | $7,060 | $24,360 |
| 2020 | $690 | $31,413 | $7,056 | $24,357 |
| 2019 | $1,179 | $26,177 | $5,880 | $20,297 |
| 2018 | $1,179 | $26,177 | $5,880 | $20,297 |
| 2017 | $1,150 | $26,177 | $5,880 | $20,297 |
| 2016 | $1,108 | $25,316 | $5,600 | $19,716 |
| 2015 | $1,084 | $25,316 | $5,600 | $19,716 |
| 2014 | $1,092 | $25,316 | $5,600 | $19,716 |
| 2013 | $1,135 | $25,316 | $5,600 | $19,716 |
Source: Public Records
Map
Nearby Homes
- 10683 State Route 364
- 11258 Ohio 364
- 3 Koehn Rd
- 5464 Ada Dr
- 115 Eastway Ct
- -_- Southway Dr
- 54124 Club Island Rd
- 508 Webb St
- 705 Magnolia St
- 437 Woodward St
- 313 Concord Ave
- 220 N Augustus St
- 909 Magnolia St
- 1502 Neil Ave
- 706 Jackson St
- 428 W Spring St
- 724 Indiana Ave
- 902 Tecumseh Dr
- 5311 Lake Dr
- 134 N Front St
- 159 Notheana Dr
- 159 Notheana Dr
- 159 Notheana Dr
- 159 Notheana Dr Unit A
- 159 Notheana Dr Unit C
- 11141 Ohio 364 Unit B
- 11141 Ohio 364
- 11141 Ohio 364 Unit 9 &10
- 6 Notheana Dr
- 11141 State Route 364
- 11141 State Route 364 Unit 10
- 7 Notheana Dr
- 5 Notheana Dr
- 158 Notheana Dr
- 158 Notheana Dr
- 158 Notheana Dr
- 158 Notheana Dr Unit A
- 11151 Ohio 364 Unit 11
- 11151 Ohio 364 Unit B
- 11151 Ohio 364