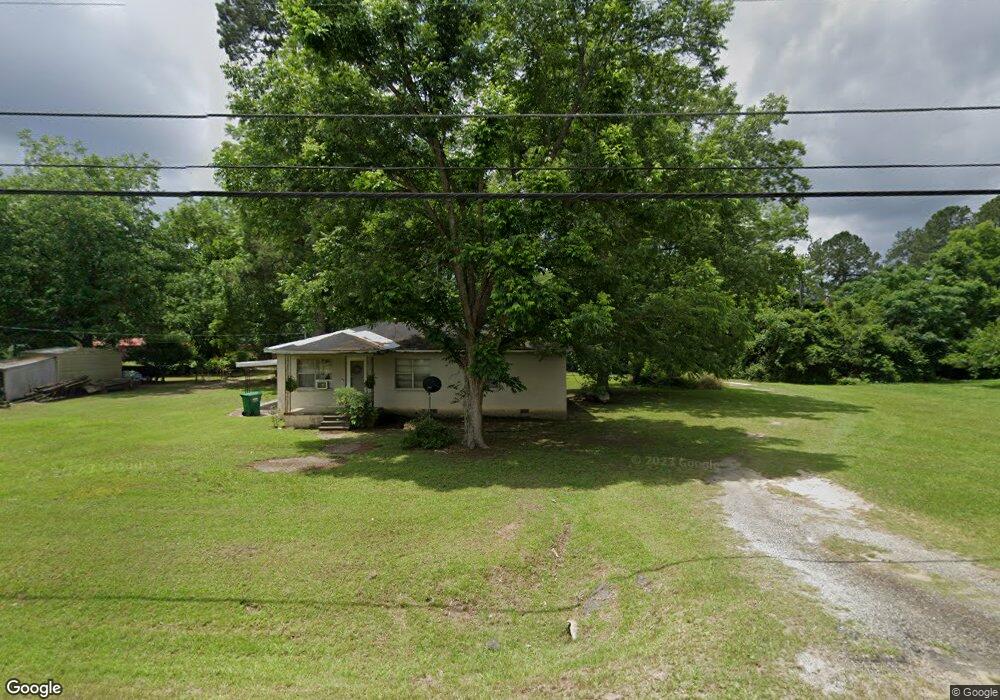
159 Russell St NE Warwick, GA 31796
Estimated Value: $84,134 - $121,000
2
Beds
1
Bath
1,050
Sq Ft
$98/Sq Ft
Est. Value
About This Home
This home is located at 159 Russell St NE, Warwick, GA 31796 and is currently estimated at $102,784, approximately $97 per square foot. 159 Russell St NE is a home located in Worth County with nearby schools including Worth County Primary School, Worth County Elementary School, and Worth County Middle School.
Create a Home Valuation Report for This Property
The Home Valuation Report is an in-depth analysis detailing your home's value as well as a comparison with similar homes in the area
Home Values in the Area
Average Home Value in this Area
Tax History Compared to Growth
Tax History
| Year | Tax Paid | Tax Assessment Tax Assessment Total Assessment is a certain percentage of the fair market value that is determined by local assessors to be the total taxable value of land and additions on the property. | Land | Improvement |
|---|---|---|---|---|
| 2024 | $257 | $15,676 | $3,300 | $12,376 |
| 2023 | $256 | $15,879 | $3,300 | $12,579 |
| 2022 | $256 | $15,879 | $3,300 | $12,579 |
| 2021 | $256 | $15,879 | $3,300 | $12,579 |
| 2020 | $256 | $15,879 | $3,300 | $12,579 |
| 2019 | $256 | $15,879 | $3,300 | $12,579 |
| 2018 | $516 | $15,879 | $3,300 | $12,579 |
| 2017 | $516 | $15,879 | $3,300 | $12,579 |
| 2016 | $256 | $15,879 | $3,300 | $12,579 |
| 2015 | $224 | $15,879 | $3,300 | $12,579 |
| 2014 | $224 | $15,880 | $3,300 | $12,579 |
| 2013 | -- | $15,880 | $3,300 | $12,579 |
| 2012 | -- | $15,879 | $3,300 | $12,579 |
Source: Public Records
Map
Nearby Homes
- 129 Main St NW
- Lot 15 Georgia-Florida Pkwy
- 0 Washington St SE
- 0 Power Dam Rd
- 484 Spring Creek Rd
- 636 Spring Creek Rd
- 480 Spring Creek Rd
- 888 Flournoy Rd
- 620 Lakeshore Dr
- 1022 Flournoy Rd
- 118 Swift Creek Rd
- 198 Swift Creek Rd
- 0 Swift Creek Rd Unit 138425
- 199 Hurt Dr
- 144 Bryant Rd
- 234 Swift Creek Rd
- 120 Cove Rd
- 102 Perch Dr
- 000 Bream Rd
- 303 Mill Branch Rd
- 147 Russell St NE
- 177 Russell St NE
- 178 Peachtree St NE
- 194 Peachtree St NE
- 143 Russell St NE
- 204 Peachtree St NE
- 166 Peachtree St NE
- 150 Russell St NE
- 150 Peachtree St NE
- 140 Russell St NE
- 128 Cherry St NW
- 122 Cherry St NE
- 212 Peachtree St NE
- 0 Peachtree St Unit 56395
- 134 Henry Rd NE
- 104 Cherry St NE
- 110 Cherry St NE
- 165 Peachtree St NE
- 178 Washington St NW
- 190 Russell St NE