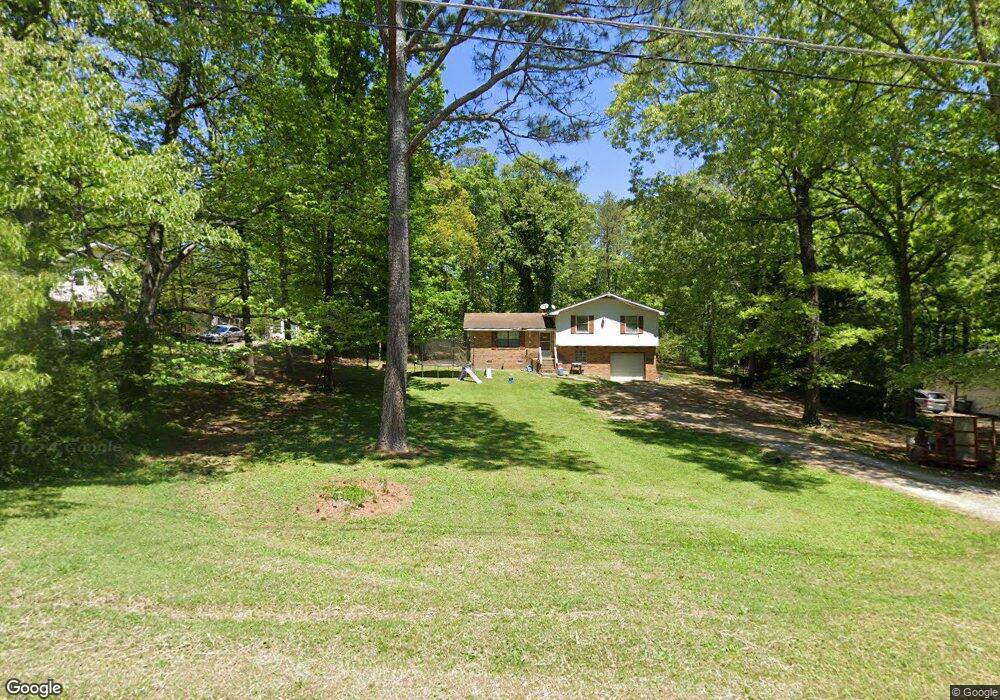
159 S Oakland Dr La Fayette, GA 30728
Estimated Value: $208,000 - $242,000
3
Beds
2
Baths
1,204
Sq Ft
$181/Sq Ft
Est. Value
About This Home
This home is located at 159 S Oakland Dr, La Fayette, GA 30728 and is currently estimated at $217,781, approximately $180 per square foot. 159 S Oakland Dr is a home located in Walker County with nearby schools including Gilbert Elementary School, Lafayette Middle School, and Lafayette High School.
Ownership History
Date
Name
Owned For
Owner Type
Purchase Details
Closed on
Mar 3, 2006
Sold by
Not Provided
Bought by
Peterson Thomas G
Current Estimated Value
Home Financials for this Owner
Home Financials are based on the most recent Mortgage that was taken out on this home.
Original Mortgage
$62,400
Outstanding Balance
$40,575
Interest Rate
6.19%
Mortgage Type
New Conventional
Estimated Equity
$177,206
Purchase Details
Closed on
Jun 11, 1981
Sold by
Shell C C
Bought by
Hogue Roy L and Hogue Leora L
Purchase Details
Closed on
Feb 28, 1981
Sold by
Wallin Donald E
Bought by
Shell C C
Purchase Details
Closed on
Jun 7, 1979
Sold by
Jumper Dexter W
Bought by
Wallin Donald E
Purchase Details
Closed on
Jan 1, 1979
Sold by
Mcconnell C C
Bought by
Jumper Dexter W
Purchase Details
Closed on
Aug 25, 1977
Sold by
Wright Thomas E
Bought by
Mcconnell C C
Purchase Details
Closed on
Mar 15, 1974
Bought by
Wright Thomas E
Create a Home Valuation Report for This Property
The Home Valuation Report is an in-depth analysis detailing your home's value as well as a comparison with similar homes in the area
Home Values in the Area
Average Home Value in this Area
Purchase History
| Date | Buyer | Sale Price | Title Company |
|---|---|---|---|
| Peterson Thomas G | $89,900 | -- | |
| Hogue Roy L | $36,000 | -- | |
| Shell C C | $2,300 | -- | |
| Wallin Donald E | -- | -- | |
| Jumper Dexter W | -- | -- | |
| Mcconnell C C | -- | -- | |
| Wright Thomas E | -- | -- |
Source: Public Records
Mortgage History
| Date | Status | Borrower | Loan Amount |
|---|---|---|---|
| Open | Peterson Thomas G | $62,400 | |
| Closed | Peterson Thomas G | $22,500 | |
| Closed | Peterson Thomas G | $50,000 |
Source: Public Records
Tax History Compared to Growth
Tax History
| Year | Tax Paid | Tax Assessment Tax Assessment Total Assessment is a certain percentage of the fair market value that is determined by local assessors to be the total taxable value of land and additions on the property. | Land | Improvement |
|---|---|---|---|---|
| 2024 | $1,536 | $69,324 | $4,026 | $65,298 |
| 2023 | $1,489 | $65,712 | $4,026 | $61,686 |
| 2022 | $1,391 | $56,714 | $4,026 | $52,688 |
| 2021 | $1,055 | $38,362 | $4,026 | $34,336 |
| 2020 | $890 | $30,842 | $4,026 | $26,816 |
| 2019 | $905 | $30,842 | $4,026 | $26,816 |
| 2018 | $816 | $30,842 | $4,026 | $26,816 |
| 2017 | $991 | $30,842 | $4,026 | $26,816 |
| 2016 | $836 | $30,842 | $4,026 | $26,816 |
| 2015 | $827 | $28,746 | $4,000 | $24,746 |
| 2014 | $740 | $28,746 | $4,000 | $24,746 |
| 2013 | -- | $28,745 | $4,000 | $24,745 |
Source: Public Records
Map
Nearby Homes
- 334 S Oakland Dr
- 300 Bronco Rd
- 1152 Magnolia St
- 1103 Sisemore St
- 1125 S Chattanooga St
- 308 Pledger Pkwy
- 39 Cook St
- 100 Lake Terrace Dr
- 221 Chota Cir
- Perry Plan at Lake Terrace
- Sullivan Plan at Lake Terrace
- Lewis Plan at Lake Terrace
- Curtis Plan at Lake Terrace
- Edmon Plan at Lake Terrace
- Wyeth Plan at Lake Terrace
- 24605 Highway 193
- 908 Gilbert Ln
- 1002 Colerain St
- 1314 W Main St
- 802 Mclemore St
- 176 S Oakland Dr
- 139 S Oakland Dr
- 185 S Oakland Dr
- 232 S Oakland Dr
- S S Oakland Dr
- 13 Red Oak Dr
- 0 S Oakland Dr Unit 931824
- 0 S Oakland Dr
- 18 Red Oak Dr
- 196 S Oakland Dr
- 117 S Oakland Dr
- 101 S Oakland Dr
- 161 S Oakland Dr
- 142 S Oakland Dr
- 0 Little Oakland Dr Unit 9004765
- 0 Little Oakland Dr
- 28 Little Oakland Dr
- 27 Little Oakland Dr
- 120 S Oakland Dr
- 106 Red Oak Dr