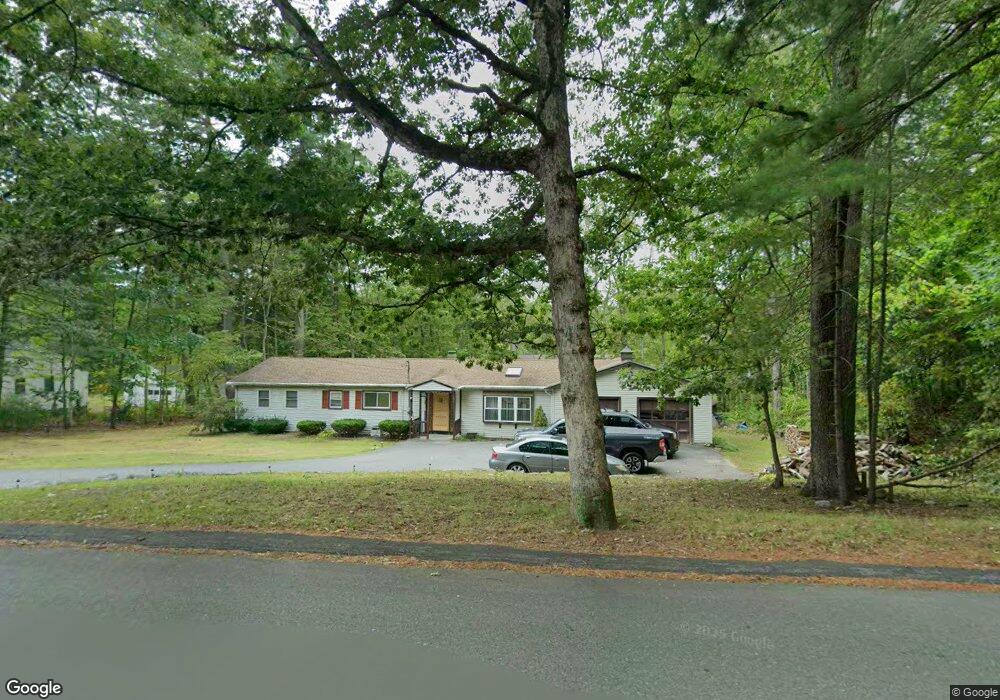
159 S Row Rd Lunenburg, MA 01462
Estimated Value: $424,000 - $525,000
3
Beds
2
Baths
1,440
Sq Ft
$341/Sq Ft
Est. Value
About This Home
This home is located at 159 S Row Rd, Lunenburg, MA 01462 and is currently estimated at $491,100, approximately $341 per square foot. 159 S Row Rd is a home located in Worcester County with nearby schools including Lunenburg Primary School and Lunenburg High School.
Ownership History
Date
Name
Owned For
Owner Type
Purchase Details
Closed on
Dec 23, 2003
Sold by
Option One Mtg Corp
Bought by
Flaherty Crissy E and Flaherty Robert
Current Estimated Value
Home Financials for this Owner
Home Financials are based on the most recent Mortgage that was taken out on this home.
Original Mortgage
$192,000
Outstanding Balance
$89,466
Interest Rate
5.96%
Mortgage Type
Purchase Money Mortgage
Estimated Equity
$401,634
Purchase Details
Closed on
Oct 27, 1995
Sold by
Sullivan Patrick J and Sullivan Christine
Bought by
Trickett Timothy J and Trickett Barbara
Create a Home Valuation Report for This Property
The Home Valuation Report is an in-depth analysis detailing your home's value as well as a comparison with similar homes in the area
Home Values in the Area
Average Home Value in this Area
Purchase History
| Date | Buyer | Sale Price | Title Company |
|---|---|---|---|
| Flaherty Crissy E | $240,000 | -- | |
| Trickett Timothy J | $120,000 | -- |
Source: Public Records
Mortgage History
| Date | Status | Borrower | Loan Amount |
|---|---|---|---|
| Open | Flaherty Crissy E | $192,000 | |
| Closed | Flaherty Crissy E | $48,000 | |
| Previous Owner | Trickett Timothy J | $182,400 | |
| Previous Owner | Trickett Timothy J | $147,750 |
Source: Public Records
Tax History
| Year | Tax Paid | Tax Assessment Tax Assessment Total Assessment is a certain percentage of the fair market value that is determined by local assessors to be the total taxable value of land and additions on the property. | Land | Improvement |
|---|---|---|---|---|
| 2025 | $5,949 | $414,300 | $118,900 | $295,400 |
| 2024 | $5,606 | $397,600 | $112,100 | $285,500 |
| 2023 | $5,507 | $376,700 | $100,900 | $275,800 |
| 2022 | $5,167 | $300,600 | $84,100 | $216,500 |
| 2020 | $5,095 | $281,200 | $84,100 | $197,100 |
| 2019 | $4,857 | $260,000 | $77,600 | $182,400 |
| 2018 | $4,498 | $228,300 | $80,900 | $147,400 |
| 2017 | $4,220 | $211,200 | $68,900 | $142,300 |
| 2016 | $4,112 | $209,700 | $69,500 | $140,200 |
| 2015 | $3,728 | $203,500 | $66,400 | $137,100 |
Source: Public Records
Map
Nearby Homes
- 167 S Row Rd
- 91 Valley Rd
- 00 Tyler Rd
- 36 Gilchrest St
- 63 Holman St
- 0 Tyler Rd Unit 72560808
- 319 Highland St
- Lot 10 Christian Cir
- 35 Leominster Rd
- 80 W Townsend Rd
- 18 Beech St
- 711 Massachusetts Ave Unit 2
- 222 W Townsend Rd
- 507/533R W Townsend Rd
- 12 Cortland Cir Unit 12
- 12 W Townsend Rd
- 756 Northfield Rd
- 481 W Townsend Rd
- 50 Old Farm Rd
- 110 Burrage St
Your Personal Tour Guide
Ask me questions while you tour the home.