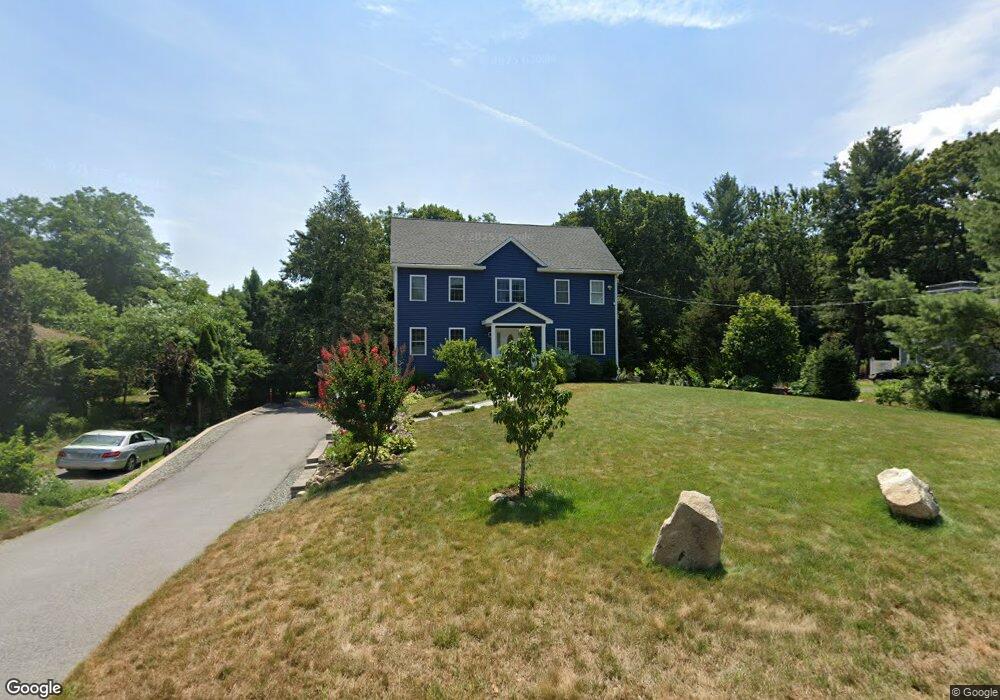
159 Salem St Lynnfield, MA 01940
Estimated Value: $689,000 - $1,041,000
2
Beds
1
Bath
1,794
Sq Ft
$509/Sq Ft
Est. Value
About This Home
This home is located at 159 Salem St, Lynnfield, MA 01940 and is currently estimated at $913,039, approximately $508 per square foot. 159 Salem St is a home located in Essex County with nearby schools including Lynnfield Middle School, Lynnfield High School, and Our Lady Of Assumption School.
Ownership History
Date
Name
Owned For
Owner Type
Purchase Details
Closed on
Aug 7, 2008
Sold by
Rosenthal Kenneth
Bought by
Dharmarajan Masilamani and Masilamani Mangaiarkarasi
Current Estimated Value
Purchase Details
Closed on
Apr 30, 2004
Sold by
Carbone Andrew J and Carbone Heidi A
Bought by
Rosenthal Kenneth
Purchase Details
Closed on
Nov 24, 1992
Sold by
Shea Charles J and Shea Caren
Bought by
Carbone Andrew J and Hagstrom Heide A
Create a Home Valuation Report for This Property
The Home Valuation Report is an in-depth analysis detailing your home's value as well as a comparison with similar homes in the area
Home Values in the Area
Average Home Value in this Area
Purchase History
| Date | Buyer | Sale Price | Title Company |
|---|---|---|---|
| Dharmarajan Masilamani | $325,000 | -- | |
| Rosenthal Kenneth | $384,500 | -- | |
| Carbone Andrew J | $151,000 | -- |
Source: Public Records
Mortgage History
| Date | Status | Borrower | Loan Amount |
|---|---|---|---|
| Open | Carbone Andrew J | $272,000 | |
| Closed | Carbone Andrew J | $277,000 |
Source: Public Records
Tax History
| Year | Tax Paid | Tax Assessment Tax Assessment Total Assessment is a certain percentage of the fair market value that is determined by local assessors to be the total taxable value of land and additions on the property. | Land | Improvement |
|---|---|---|---|---|
| 2025 | $9,153 | $866,800 | $465,700 | $401,100 |
| 2024 | $8,700 | $827,800 | $443,500 | $384,300 |
| 2023 | $8,009 | $708,800 | $368,100 | $340,700 |
| 2022 | $8,481 | $707,300 | $333,100 | $374,200 |
| 2021 | $8,771 | $661,000 | $308,500 | $352,500 |
| 2020 | $5,809 | $417,300 | $278,400 | $138,900 |
| 2019 | $5,419 | $389,600 | $250,700 | $138,900 |
| 2018 | $5,262 | $382,400 | $250,700 | $131,700 |
| 2017 | $4,955 | $359,600 | $227,900 | $131,700 |
| 2016 | $5,090 | $351,000 | $227,900 | $123,100 |
| 2015 | $4,647 | $320,700 | $203,400 | $117,300 |
Source: Public Records
Map
Nearby Homes
Your Personal Tour Guide
Ask me questions while you tour the home.