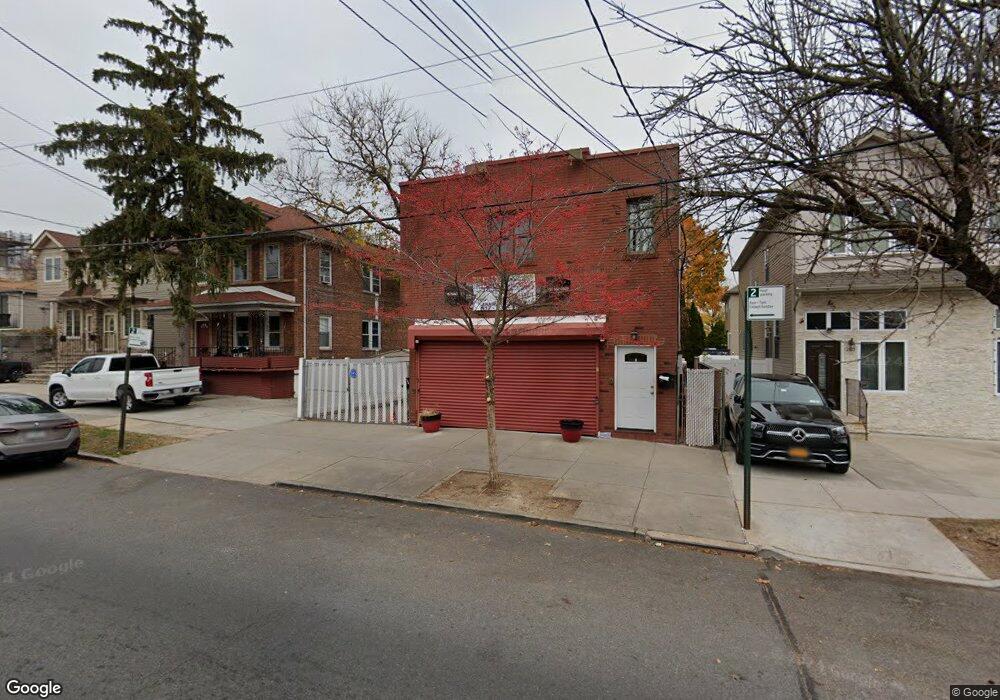
159 Sand Ln Staten Island, NY 10305
South Beach NeighborhoodEstimated Value: $946,475
--
Bed
--
Bath
2,400
Sq Ft
$394/Sq Ft
Est. Value
About This Home
This home is located at 159 Sand Ln, Staten Island, NY 10305 and is currently estimated at $946,475, approximately $394 per square foot. 159 Sand Ln is a home located in Richmond County with nearby schools including P.S. 39 The Francis J. Murphy Jr. School, I.S. 49 Berta A Dreyfus, and Curtis High School.
Ownership History
Date
Name
Owned For
Owner Type
Purchase Details
Closed on
Oct 15, 2024
Sold by
159 Sand Lane Llc
Bought by
Sandy Shore Estate Llc
Current Estimated Value
Purchase Details
Closed on
Nov 9, 2016
Sold by
Woitkowski Matthew
Bought by
159 Sand Lane Llc
Purchase Details
Closed on
Jun 24, 2005
Sold by
Capasso Bernard and Capasso Marie
Bought by
Woitkowski Matthew
Create a Home Valuation Report for This Property
The Home Valuation Report is an in-depth analysis detailing your home's value as well as a comparison with similar homes in the area
Home Values in the Area
Average Home Value in this Area
Purchase History
| Date | Buyer | Sale Price | Title Company |
|---|---|---|---|
| Sandy Shore Estate Llc | $900,000 | None Listed On Document | |
| 159 Sand Lane Llc | $735,000 | None Available | |
| Woitkowski Matthew | $535,000 | United General Title Ins Co |
Source: Public Records
Tax History Compared to Growth
Tax History
| Year | Tax Paid | Tax Assessment Tax Assessment Total Assessment is a certain percentage of the fair market value that is determined by local assessors to be the total taxable value of land and additions on the property. | Land | Improvement |
|---|---|---|---|---|
| 2025 | $6,238 | $65,040 | $6,347 | $58,693 |
| 2024 | $6,238 | $55,860 | $6,972 | $48,888 |
| 2023 | $5,951 | $29,300 | $6,599 | $22,701 |
| 2022 | $5,849 | $43,980 | $12,540 | $31,440 |
| 2021 | $6,119 | $38,160 | $12,540 | $25,620 |
| 2020 | $5,807 | $37,740 | $12,540 | $25,200 |
| 2019 | $5,414 | $35,040 | $12,540 | $22,500 |
| 2018 | $4,977 | $24,417 | $10,479 | $13,938 |
| 2017 | $4,977 | $24,417 | $11,142 | $13,275 |
| 2016 | $4,844 | $24,230 | $10,961 | $13,269 |
| 2015 | $4,139 | $22,861 | $12,410 | $10,451 |
| 2014 | $4,139 | $21,567 | $10,039 | $11,528 |
Source: Public Records
Map
Nearby Homes