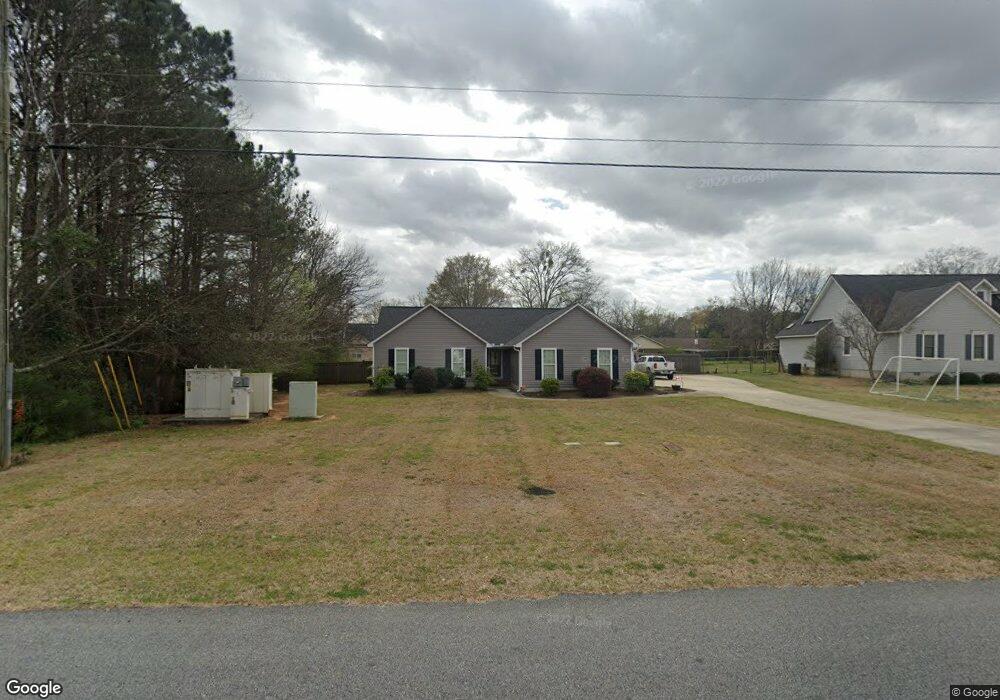
159 Stonefield Cir Macon, GA 31216
Estimated Value: $231,691 - $271,000
3
Beds
2
Baths
1,512
Sq Ft
$162/Sq Ft
Est. Value
About This Home
This home is located at 159 Stonefield Cir, Macon, GA 31216 and is currently estimated at $244,423, approximately $161 per square foot. 159 Stonefield Cir is a home located in Bibb County with nearby schools including Porter Elementary School, Rutland Middle School, and Rutland High School.
Ownership History
Date
Name
Owned For
Owner Type
Purchase Details
Closed on
Dec 31, 2019
Sold by
White John W and White Jackie
Bought by
Whaley Joshua Dean and Wright Heather Ann
Current Estimated Value
Home Financials for this Owner
Home Financials are based on the most recent Mortgage that was taken out on this home.
Original Mortgage
$132,554
Outstanding Balance
$116,613
Interest Rate
3.6%
Mortgage Type
FHA
Estimated Equity
$127,810
Purchase Details
Closed on
Jun 10, 2016
Sold by
White Jackie
Bought by
White John W and White Jackie
Purchase Details
Closed on
Feb 26, 2016
Sold by
Webb Jack
Bought by
White Jackie
Home Financials for this Owner
Home Financials are based on the most recent Mortgage that was taken out on this home.
Original Mortgage
$101,750
Interest Rate
3.25%
Mortgage Type
FHA
Purchase Details
Closed on
Nov 15, 2013
Sold by
Webb Jack
Bought by
Webb Jack and White Jackie
Purchase Details
Closed on
Jun 23, 2003
Bought by
Webb Jack and Evelyn Louise
Purchase Details
Closed on
Oct 1, 1997
Create a Home Valuation Report for This Property
The Home Valuation Report is an in-depth analysis detailing your home's value as well as a comparison with similar homes in the area
Purchase History
| Date | Buyer | Sale Price | Title Company |
|---|---|---|---|
| Whaley Joshua Dean | $135,000 | None Available | |
| White John W | -- | -- | |
| White Jackie | -- | -- | |
| Webb Jack | -- | None Available | |
| Webb Jack | -- | -- | |
| -- | $11,000 | -- |
Source: Public Records
Mortgage History
| Date | Status | Borrower | Loan Amount |
|---|---|---|---|
| Open | Whaley Joshua Dean | $132,554 | |
| Previous Owner | White Jackie | $101,750 |
Source: Public Records
Tax History
| Year | Tax Paid | Tax Assessment Tax Assessment Total Assessment is a certain percentage of the fair market value that is determined by local assessors to be the total taxable value of land and additions on the property. | Land | Improvement |
|---|---|---|---|---|
| 2025 | $1,816 | $80,882 | $14,000 | $66,882 |
| 2024 | $1,857 | $80,137 | $14,000 | $66,137 |
| 2023 | $1,737 | $68,404 | $14,000 | $54,404 |
| 2022 | $2,401 | $69,351 | $8,589 | $60,762 |
| 2021 | $2,305 | $60,662 | $7,218 | $53,444 |
| 2020 | $2,096 | $56,280 | $6,496 | $49,784 |
| 2019 | $2,085 | $53,271 | $5,774 | $47,497 |
| 2018 | $3,236 | $50,984 | $5,774 | $45,210 |
| 2017 | $1,835 | $48,976 | $6,054 | $42,922 |
| 2016 | $1,194 | $48,976 | $6,054 | $42,922 |
| 2015 | $1,240 | $39,672 | $6,054 | $33,619 |
| 2014 | $1,240 | $39,672 | $6,054 | $33,619 |
Source: Public Records
Map
Nearby Homes
- 3720 Dean Dr
- 3708 Jones Rd
- 308 Ellis Ct
- 3491 Sandy Cir
- 6670 Fran Dr
- 6045 Cara Dr
- 405 Stonecrest Ct
- 5608 Swymer Dr
- 3150 Holleman Dr
- 361 Thoroughbred Ln
- 122 Hudson Way
- 813 Ocala National Trail
- 123 Hudson Way
- 106 Hudson Way
- 3533 Bridgewood Dr
- 201 Liberty Trace
- 6414 Ponderosa Dr
- 3636 Bonanza Dr
- 109 Oakview Club Dr
- 155 Stonefield Cir
- 165 Stonefield Cir
- 3657 Jones Rd
- 151 Stonefield Cir
- 156 Stonefield Cir
- 3663 Jones Rd
- 160 Stonefield Cir
- 152 Stonefield Cir
- 171 Stonefield Cir
- 164 Stonefield Cir
- 3649 Jones Rd
- 3684 Dean Dr
- 148 Stonefield Cir
- 3621 Jones Rd
- 168 Stonefield Cir
- 3688 Dean Dr
- 3673 Jones Rd
- 145 Ellis Way
- 3660 Jones Rd
- 141 Ellis Way
Your Personal Tour Guide
Ask me questions while you tour the home.