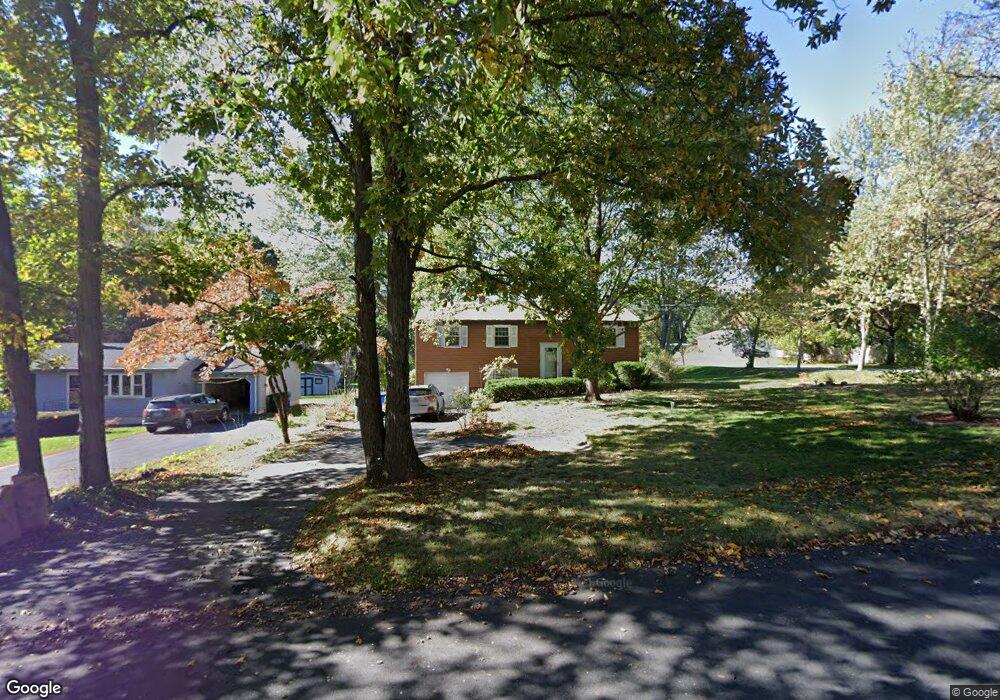
159 Torringford East St Torrington, CT 06790
Estimated Value: $300,000 - $332,420
3
Beds
3
Baths
1,134
Sq Ft
$279/Sq Ft
Est. Value
About This Home
This home is located at 159 Torringford East St, Torrington, CT 06790 and is currently estimated at $316,105, approximately $278 per square foot. 159 Torringford East St is a home located in Litchfield County with nearby schools including Torrington Middle School, Torrington High School, and Torrington Christian Academy.
Ownership History
Date
Name
Owned For
Owner Type
Purchase Details
Closed on
Jun 9, 2021
Sold by
Komons Marcus and Comons Debra
Bought by
Komons Marcus
Current Estimated Value
Purchase Details
Closed on
Aug 30, 1999
Sold by
Dixon Scott D and Dixon Ann M
Bought by
Komons Marcus and Komons Debra
Home Financials for this Owner
Home Financials are based on the most recent Mortgage that was taken out on this home.
Original Mortgage
$107,000
Interest Rate
7.53%
Purchase Details
Closed on
Apr 17, 1990
Sold by
Bondler Ronald S
Bought by
Dixon Scott D
Home Financials for this Owner
Home Financials are based on the most recent Mortgage that was taken out on this home.
Original Mortgage
$126,300
Interest Rate
10.13%
Purchase Details
Closed on
Dec 24, 1987
Sold by
Storrs Robert E
Bought by
Bandler Ronald S
Create a Home Valuation Report for This Property
The Home Valuation Report is an in-depth analysis detailing your home's value as well as a comparison with similar homes in the area
Home Values in the Area
Average Home Value in this Area
Purchase History
| Date | Buyer | Sale Price | Title Company |
|---|---|---|---|
| Komons Marcus | -- | None Available | |
| Komons Marcus | $113,000 | -- | |
| Dixon Scott D | $136,500 | -- | |
| Bandler Ronald S | $139,000 | -- |
Source: Public Records
Mortgage History
| Date | Status | Borrower | Loan Amount |
|---|---|---|---|
| Previous Owner | Bandler Ronald S | $106,150 | |
| Previous Owner | Bandler Ronald S | $107,000 | |
| Previous Owner | Bandler Ronald S | $106,000 | |
| Previous Owner | Bandler Ronald S | $126,300 |
Source: Public Records
Tax History Compared to Growth
Tax History
| Year | Tax Paid | Tax Assessment Tax Assessment Total Assessment is a certain percentage of the fair market value that is determined by local assessors to be the total taxable value of land and additions on the property. | Land | Improvement |
|---|---|---|---|---|
| 2025 | $6,941 | $180,530 | $20,370 | $160,160 |
| 2024 | $4,719 | $98,380 | $20,370 | $78,010 |
| 2023 | $4,718 | $98,380 | $20,370 | $78,010 |
| 2022 | $4,638 | $98,380 | $20,370 | $78,010 |
| 2021 | $4,542 | $98,380 | $20,370 | $78,010 |
| 2020 | $4,542 | $98,380 | $20,370 | $78,010 |
| 2019 | $3,629 | $78,610 | $20,370 | $58,240 |
| 2018 | $3,629 | $78,610 | $20,370 | $58,240 |
| 2017 | $3,596 | $78,610 | $20,370 | $58,240 |
| 2016 | $3,596 | $78,610 | $20,370 | $58,240 |
| 2015 | $3,596 | $78,610 | $20,370 | $58,240 |
| 2014 | $4,330 | $119,210 | $41,640 | $77,570 |
Source: Public Records
Map
Nearby Homes
- 73 Shirley Rd
- 51 Bradford Rd
- 111 Oxbow Dr
- 21 Oak Meadow Ln
- 65 Oak Meadow Ln Unit 65
- 325 Circle Dr
- 410 Circle Dr
- 595 Torringford St
- 69 Sunrise Dr
- 100 Nutmeg Dr
- 714 Torringford St
- 144 Morningside Dr
- 33 Dawn Ave
- 211 Lyman Dr
- 157 Edgewood Dr
- 175 Ramstein Rd
- 178 Edgewood Dr
- 141 Highfield Dr
- 0 Torringford St W
- 29 Hannah Way
- 240 Bradford Rd
- 181 Torringford East St
- 147 Torringford East St
- 237 Bradford Rd
- 230 Bradford Rd
- 133 Torringford East St
- 193 Torringford East St
- 6 Stonefield Way
- 30 Shirley Rd
- 210 Bradford Rd
- 207 Bradford Rd
- 42 Shirley Rd
- 12 Shirley Rd
- 517 Oxbow Dr
- 534 Oxbow Dr
- 205 Torringford East St
- 196 Bradford Rd
- 56 Shirley Rd
- 503 Oxbow Dr
- 520 Oxbow Dr