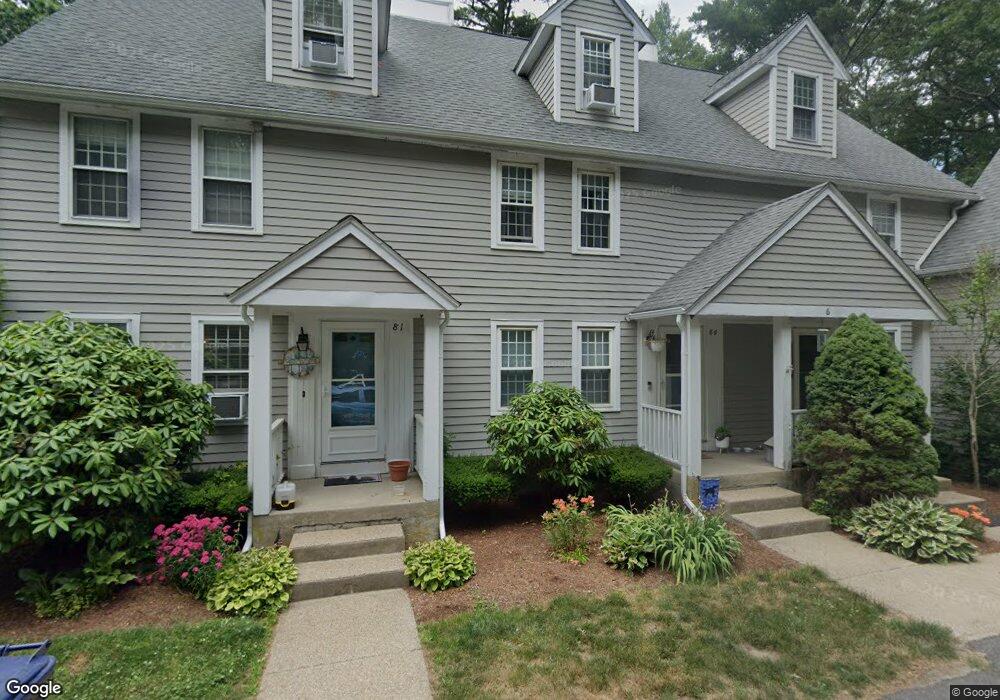
159 Twin Lakes Dr Halifax, MA 02338
Estimated Value: $394,000 - $488,000
3
Beds
1
Bath
1,375
Sq Ft
$308/Sq Ft
Est. Value
About This Home
This home is located at 159 Twin Lakes Dr, Halifax, MA 02338 and is currently estimated at $423,876, approximately $308 per square foot. 159 Twin Lakes Dr is a home located in Plymouth County with nearby schools including Silver Lake Regional High School, Halifax Elementary School, and Silver Lake Regional Middle School.
Ownership History
Date
Name
Owned For
Owner Type
Purchase Details
Closed on
Jun 29, 2018
Sold by
Logiudice Stephanie and Wells Fargo Bank Na Tr
Bought by
2012 Llc
Current Estimated Value
Home Financials for this Owner
Home Financials are based on the most recent Mortgage that was taken out on this home.
Original Mortgage
$185,000
Outstanding Balance
$160,685
Interest Rate
4.6%
Mortgage Type
New Conventional
Estimated Equity
$263,191
Purchase Details
Closed on
Oct 30, 2003
Sold by
Coffey Richard Stephen
Bought by
Logiudice Stephanie Marie
Purchase Details
Closed on
Mar 31, 2000
Sold by
Stoltz Daniel J and Stoltz Eve Ann
Bought by
Coffey Richard S
Purchase Details
Closed on
Jan 15, 1999
Sold by
First Baptist Church
Bought by
Stoltz Daniel J and Stoltz Eve A
Purchase Details
Closed on
Dec 27, 1988
Sold by
Whitaker Wayne C
Bought by
1St Baptist Church Of
Create a Home Valuation Report for This Property
The Home Valuation Report is an in-depth analysis detailing your home's value as well as a comparison with similar homes in the area
Home Values in the Area
Average Home Value in this Area
Purchase History
| Date | Buyer | Sale Price | Title Company |
|---|---|---|---|
| 2012 Llc | $155,000 | -- | |
| Logiudice Stephanie Marie | $213,500 | -- | |
| Coffey Richard S | $141,000 | -- | |
| Stoltz Daniel J | $107,000 | -- | |
| 1St Baptist Church Of | $110,000 | -- |
Source: Public Records
Mortgage History
| Date | Status | Borrower | Loan Amount |
|---|---|---|---|
| Open | 2012 Llc | $185,000 | |
| Previous Owner | 1St Baptist Church Of | $198,750 | |
| Previous Owner | 1St Baptist Church Of | $39,750 |
Source: Public Records
Tax History
| Year | Tax Paid | Tax Assessment Tax Assessment Total Assessment is a certain percentage of the fair market value that is determined by local assessors to be the total taxable value of land and additions on the property. | Land | Improvement |
|---|---|---|---|---|
| 2025 | $4,780 | $335,000 | $0 | $335,000 |
| 2024 | $4,824 | $335,000 | $0 | $335,000 |
| 2023 | $4,455 | $299,400 | $0 | $299,400 |
| 2022 | $4,027 | $251,500 | $0 | $251,500 |
| 2021 | $3,887 | $223,500 | $0 | $223,500 |
| 2020 | $3,823 | $219,200 | $0 | $219,200 |
| 2019 | $3,431 | $196,400 | $0 | $196,400 |
| 2018 | $3,241 | $183,600 | $0 | $183,600 |
| 2017 | $3,211 | $173,300 | $0 | $173,300 |
| 2016 | $2,749 | $142,800 | $0 | $142,800 |
| 2015 | $2,742 | $144,400 | $0 | $144,400 |
Source: Public Records
Map
Nearby Homes
- 315 Twin Lakes Dr Unit 315
- 37 Annawon Dr
- 1 Poplar Rd
- 528 Twin Lakes Dr
- 25 Lawrence Rd
- 0 Thompson St
- 151 Plymouth St Unit 151A
- 4 Upton St
- 0 Union Park St
- 115 Waltham St
- 3 Natureway Cir
- 343 Monponsett St
- 20 Forestdale Dr
- 102 Leon Ct
- 820 Center St
- 15 Forest St
- 8 Beechwood Rd
- 1 Ferndale Dr
- 265 Monponsett St Unit 2210
- 265 Monponsett St Unit 2203
- 165 Twin Lakes Dr
- 162 Twin Lakes Dr
- 156 Twin Lakes Dr
- 153 Twin Lakes Dr
- 159 Twin Lakes Dr Unit 159
- 153 Twin Lakes Dr Unit 153
- 150 Twin Lakes Dr
- 147 Twin Lakes Dr
- 144 Twin Lakes Dr
- 141 Twin Lakes Dr
- 138 Twin Lakes Dr
- 141 Twin Lakes Dr Unit 141
- 138 Twin Lakes Dr Unit 138
- 138 Twin Lakes Dr Unit 128
- 180 Twin Lakes Dr
- 177 Twin Lakes Dr
- 171 Twin Lakes Dr
- 168 Twin Lakes Dr
- 180 Twin Lakes Dr Unit 180
- 177 Twin Lakes Dr Unit 177
Your Personal Tour Guide
Ask me questions while you tour the home.