Estimated Value: $263,000 - $451,000
3
Beds
2
Baths
2,092
Sq Ft
$161/Sq Ft
Est. Value
About This Home
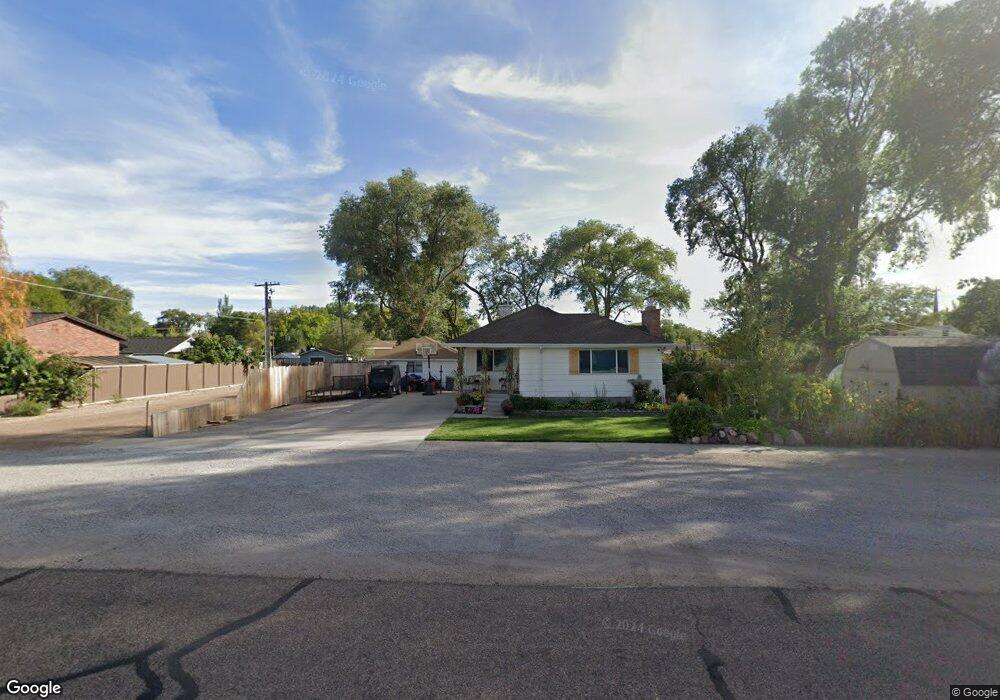
This home is located at 159 W 300 N, Delta, UT 84624 and is currently estimated at $336,455, approximately $160 per square foot. 159 W 300 N is a home located in Millard County with nearby schools including Cba Center and White River Academy.
Ownership History
Date
Name
Owned For
Owner Type
Purchase Details
Closed on
Oct 12, 2021
Sold by
Bryan Benjamin K and Bryan Jaclyn W
Bought by
Bryan Benjamin
Current Estimated Value
Purchase Details
Closed on
Dec 11, 2020
Sold by
Greathous Gary F
Bought by
Huber Steven and Huber Megan
Home Financials for this Owner
Home Financials are based on the most recent Mortgage that was taken out on this home.
Original Mortgage
$64,000
Outstanding Balance
$56,716
Interest Rate
2.7%
Mortgage Type
New Conventional
Estimated Equity
$279,739
Purchase Details
Closed on
Mar 27, 2012
Sold by
Greathouse John S
Bought by
Greathouse Gary F and Greathouse Carol T
Purchase Details
Closed on
Jun 9, 2009
Sold by
Dehart Cheryl
Bought by
Greathouse Denise
Purchase Details
Closed on
May 29, 2009
Sold by
Greathouse Denise and Dehart Cheryl G
Bought by
Gtreathouse Denise
Create a Home Valuation Report for This Property
The Home Valuation Report is an in-depth analysis detailing your home's value as well as a comparison with similar homes in the area
Home Values in the Area
Average Home Value in this Area
Purchase History
| Date | Buyer | Sale Price | Title Company |
|---|---|---|---|
| Bryan Benjamin | -- | Old Republic Title | |
| Huber Steven | -- | First American Title Insuran | |
| Greathouse Gary F | -- | -- | |
| Greathouse Denise | -- | -- | |
| Gtreathouse Denise | -- | -- |
Source: Public Records
Mortgage History
| Date | Status | Borrower | Loan Amount |
|---|---|---|---|
| Open | Huber Steven | $64,000 |
Source: Public Records
Tax History Compared to Growth
Tax History
| Year | Tax Paid | Tax Assessment Tax Assessment Total Assessment is a certain percentage of the fair market value that is determined by local assessors to be the total taxable value of land and additions on the property. | Land | Improvement |
|---|---|---|---|---|
| 2025 | $2,597 | $277,888 | $33,126 | $244,762 |
| 2024 | $2,597 | $220,439 | $23,770 | $196,669 |
| 2023 | $2,760 | $220,439 | $23,770 | $196,669 |
| 2022 | $2,229 | $167,732 | $24,851 | $142,881 |
| 2021 | $1,885 | $135,429 | $18,791 | $116,638 |
| 2020 | $965 | $68,868 | $9,395 | $59,473 |
| 2019 | $891 | $63,578 | $8,699 | $54,879 |
| 2018 | $820 | $59,047 | $8,699 | $50,348 |
| 2017 | $848 | $58,794 | $8,446 | $50,348 |
| 2016 | $821 | $58,794 | $8,446 | $50,348 |
| 2015 | $821 | $58,794 | $8,446 | $50,348 |
| 2014 | -- | $54,440 | $8,461 | $45,979 |
| 2013 | -- | $54,440 | $8,461 | $45,979 |
Source: Public Records
Map
Nearby Homes
- 325 N 100 W
- 331 W 200 N
- 451 W 300 N
- 163 W 100 S
- 0 E Highway 6 Unit LotWP001 16586023
- 435 W 100 S
- 44 E 300 S
- 242 S 400 W
- 294 S 300 W
- 328 S Center St
- 32 E 300 S
- 38 E 300 S
- 98 W 1000 N
- 445 Topaz Blvd Unit 10
- 461 Topaz Blvd Unit 6
- 7900 E 250 Rd N
- 321 E 200 S
- 629 E Millard St
- 628 Sunset St
- 901 E 750 Rd N