
Seller's Agent in 2024
Lena Simpson
Compass
(917) 664-6617
2 in this area
15 Total Sales
Estimated Value: $416,000 - $800,000
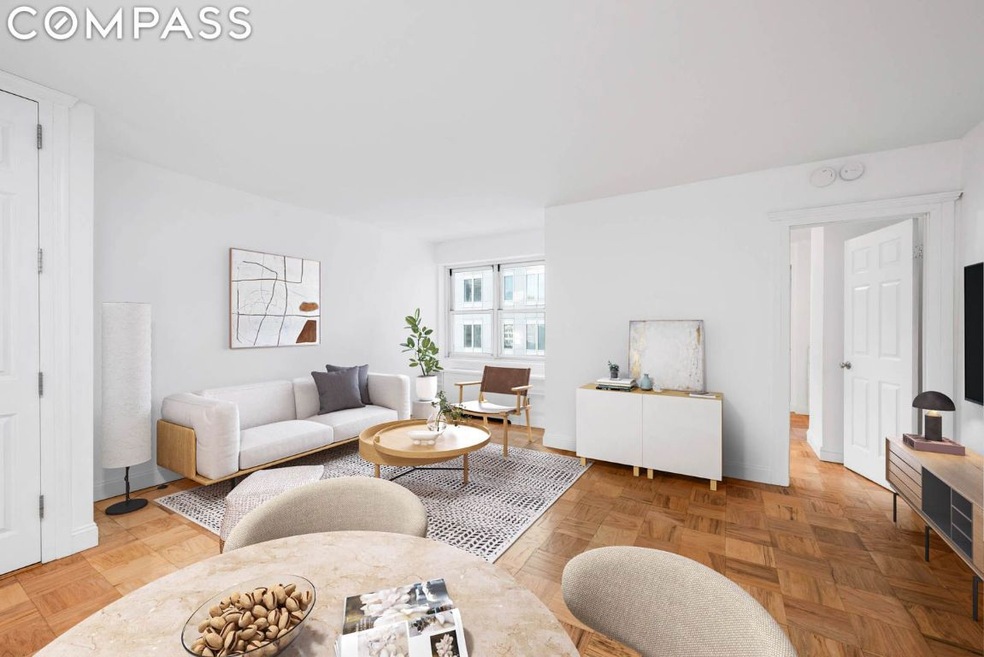
Tower 53 high floor Jr. 1 Bedroom with city views and a charming glimpse of Central Park. The apartment has beautiful newly refinished hardwood floors throughout, windowed bathroom with a tub plus four large closets and built-in closets in the bedroom.
The prime location of Tower 53 places you at the heart of NYC's most iconic attractions, including Central Park, Broadway, Rockefeller Center, MoMA, and Broadway Theaters. Convenience is at your fingertips with close proximity to D, E, N, R, Q & 1 subway lines, ensuring seamless connectivity to the rest of the city. Tower 53 features a 24-hour white glove doorman and concierge services, offering security and assistance at your convenience. Elevate your social gatherings on the beautiful rooftop deck, providing a picturesque backdrop of Central Park. With onsite parking available, your urban lifestyle is effortlessly accommodated.
Whether you're seeking the perfect starter home, a pied-a-terre, or a savvy investment opportunity, Tower 53 presents an unparalleled living experience in the heart of New York City. Embrace a lifestyle of sophistication and comfort in this exceptional residence.
Electric is included in your HOA. There is a $98.24 monthly fuel assessment.
| Date | Buyer | Sale Price | Title Company |
|---|---|---|---|
| -- | $585,000 | -- | |
| Hung Chia-Wen | $379,000 | -- | |
| Hung Chia-Wen | $379,000 | -- | |
| Rao Swati Y | -- | -- | |
| Rao Swati Y | -- | -- | |
| Ami Properties Ltd | $92,000 | Fidelity National Title Ins | |
| Ami Properties Ltd | $92,000 | Fidelity National Title Ins | |
| E V Aviation Ltd | -- | -- | |
| E V Aviation Ltd | -- | -- |
| Date | Status | Borrower | Loan Amount |
|---|---|---|---|
| Previous Owner | Rao Swati Y | $240,000 | |
| Previous Owner | Rao Swati Y | $30,000 |
| Date | Event | Price | List to Sale | Price per Sq Ft |
|---|---|---|---|---|
| 11/22/2024 11/22/24 | Sold | $585,000 | +17105.9% | $1,170 / Sq Ft |
| 08/27/2024 08/27/24 | Pending | -- | -- | -- |
| 06/22/2024 06/22/24 | Rented | $3,400 | +3.0% | -- |
| 06/19/2024 06/19/24 | Under Contract | -- | -- | -- |
| 06/08/2024 06/08/24 | For Rent | $3,300 | 0.0% | -- |
| 06/08/2024 06/08/24 | Price Changed | $595,000 | 0.0% | $1,190 / Sq Ft |
| 06/08/2024 06/08/24 | For Sale | $595,000 | -0.7% | $1,190 / Sq Ft |
| 05/03/2024 05/03/24 | Pending | -- | -- | -- |
| 04/06/2024 04/06/24 | Price Changed | $599,000 | -7.8% | $1,198 / Sq Ft |
| 02/10/2024 02/10/24 | Price Changed | $650,000 | -3.7% | $1,300 / Sq Ft |
| 01/11/2024 01/11/24 | For Sale | $675,000 | -- | $1,350 / Sq Ft |
| Year | Tax Paid | Tax Assessment Tax Assessment Total Assessment is a certain percentage of the fair market value that is determined by local assessors to be the total taxable value of land and additions on the property. | Land | Improvement |
|---|---|---|---|---|
| 2025 | $13,264 | $109,192 | $25,554 | $83,638 |
| 2024 | $13,264 | $108,414 | $25,554 | $82,860 |
| 2023 | $11,131 | $112,312 | $25,554 | $86,758 |
| 2022 | $8,247 | $113,582 | $25,554 | $88,028 |
| 2021 | $13,520 | $115,673 | $25,554 | $90,119 |
| 2020 | $11,279 | $128,121 | $25,554 | $102,567 |
| 2019 | $10,422 | $125,241 | $25,554 | $99,687 |
| 2018 | $11,896 | $117,465 | $25,554 | $91,911 |
| 2017 | $11,224 | $105,479 | $25,554 | $79,925 |
| 2016 | $10,393 | $109,798 | $25,554 | $84,244 |
| 2015 | $5,503 | $89,748 | $25,554 | $64,194 |
| 2014 | $5,503 | $88,508 | $25,554 | $62,954 |
Seller's Agent in 2024
Lena Simpson
Compass
(917) 664-6617
2 in this area
15 Total Sales
Source: Real Estate Board of New York (REBNY)
MLS Number: RLS10967054
APN: 1006-1186
Disclaimer: Certain information contained herein is derived from information provided by parties other than Homes.com. All information provided is deemed reliable, but is not guaranteed to be accurate and should be independently verified.
![]() This information is not verified for authenticity or accuracy and is not guaranteed and may not reflect all real estate activity in the market. ©2025 The Real Estate Board of New York, Inc., All rights reserved.
This information is not verified for authenticity or accuracy and is not guaranteed and may not reflect all real estate activity in the market. ©2025 The Real Estate Board of New York, Inc., All rights reserved.
RLS Data display by Homes.com LLC