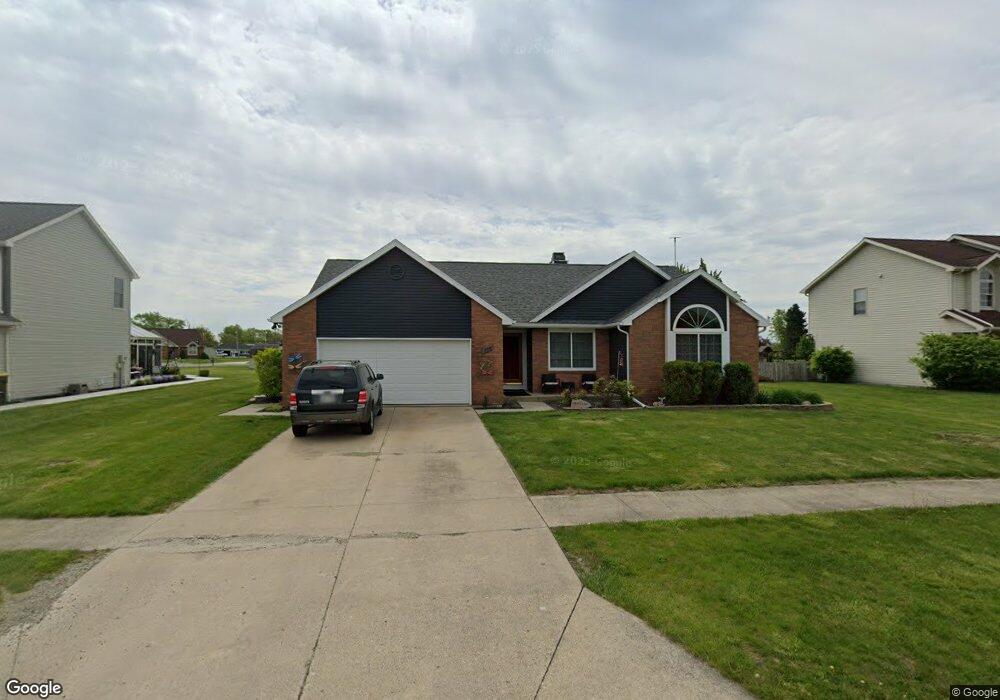
159 W Pinewood Ave Defiance, OH 43512
Estimated Value: $231,000 - $278,000
3
Beds
2
Baths
1,564
Sq Ft
$167/Sq Ft
Est. Value
About This Home
This home is located at 159 W Pinewood Ave, Defiance, OH 43512 and is currently estimated at $261,547, approximately $167 per square foot. 159 W Pinewood Ave is a home located in Defiance County with nearby schools including Defiance Elementary School, Defiance Middle School, and Defiance High School.
Ownership History
Date
Name
Owned For
Owner Type
Purchase Details
Closed on
Dec 9, 2021
Sold by
Bergman Chris R and Bergman Bobbie L
Bought by
Bergman Chris R
Current Estimated Value
Home Financials for this Owner
Home Financials are based on the most recent Mortgage that was taken out on this home.
Original Mortgage
$143,200
Outstanding Balance
$133,051
Interest Rate
3.11%
Mortgage Type
New Conventional
Estimated Equity
$128,496
Purchase Details
Closed on
Nov 22, 2011
Sold by
Engle Thomas M
Bought by
Bergman Chris R
Home Financials for this Owner
Home Financials are based on the most recent Mortgage that was taken out on this home.
Original Mortgage
$128,200
Interest Rate
3.99%
Mortgage Type
New Conventional
Purchase Details
Closed on
Feb 11, 2006
Sold by
Schroeder John and Schroeder Elizabeth
Bought by
Engle Thomas M
Home Financials for this Owner
Home Financials are based on the most recent Mortgage that was taken out on this home.
Original Mortgage
$24,230
Interest Rate
6.2%
Mortgage Type
Stand Alone Second
Purchase Details
Closed on
May 31, 2001
Bought by
Bergman Chris R
Purchase Details
Closed on
Feb 21, 1996
Bought by
Bergman Chris R
Create a Home Valuation Report for This Property
The Home Valuation Report is an in-depth analysis detailing your home's value as well as a comparison with similar homes in the area
Home Values in the Area
Average Home Value in this Area
Purchase History
| Date | Buyer | Sale Price | Title Company |
|---|---|---|---|
| Bergman Chris R | -- | Rosenberg Pllc | |
| Bergman Chris R | -- | None Available | |
| Engle Thomas M | $121,875 | None Available | |
| Bergman Chris R | $155,300 | -- | |
| Bergman Chris R | $115,000 | -- |
Source: Public Records
Mortgage History
| Date | Status | Borrower | Loan Amount |
|---|---|---|---|
| Open | Bergman Chris R | $143,200 | |
| Previous Owner | Bergman Chris R | $20,150 | |
| Previous Owner | Bergman Chris R | $128,200 | |
| Previous Owner | Engle Thomas M | $24,230 | |
| Previous Owner | Engle Thomas M | $130,000 |
Source: Public Records
Tax History Compared to Growth
Tax History
| Year | Tax Paid | Tax Assessment Tax Assessment Total Assessment is a certain percentage of the fair market value that is determined by local assessors to be the total taxable value of land and additions on the property. | Land | Improvement |
|---|---|---|---|---|
| 2024 | $2,897 | $77,160 | $8,830 | $68,330 |
| 2023 | $2,897 | $77,160 | $8,830 | $68,330 |
| 2022 | $2,448 | $58,240 | $8,830 | $49,410 |
| 2021 | $2,448 | $58,240 | $8,830 | $49,410 |
| 2020 | $2,468 | $58,240 | $8,830 | $49,410 |
| 2019 | $2,226 | $51,370 | $8,840 | $42,530 |
| 2018 | $2,165 | $51,370 | $8,840 | $42,530 |
| 2017 | $2,135 | $51,366 | $8,837 | $42,529 |
| 2016 | $2,102 | $49,056 | $8,718 | $40,338 |
| 2015 | $841 | $49,056 | $8,718 | $40,338 |
| 2014 | $841 | $49,056 | $8,718 | $40,338 |
| 2013 | $841 | $47,040 | $8,718 | $38,322 |
| 2012 | $841 | $47,041 | $8,719 | $38,322 |
Source: Public Records
Map
Nearby Homes
- 130 W Pinewood Ave
- 0 Jasica Ct
- 1963 Sherwood Dr
- 1839 Sherwood Dr
- 1819 Sherwood Dr
- 1673 Evan Dr
- 1623 Evan Dr
- 156 Cleveland Ave
- 2930 S State Route 66
- 00 Melody Ln
- 786 Miami Dr
- 13332 State Route 15
- 1211 Powell View Dr
- 1692 Durango Dr
- 1301 Ottawa Ave
- 24653 Watson Rd
- 1101 Jefferson Ave
- 1528 Terrawenda Dr
- 8627 Ohio 66
- 951 Grove St
- 169 W Pinewood Ave
- 131 Ponderosa Pine Dr
- 150 W Pinewood Ave
- 160 W Pinewood Ave
- 121 Ponderosa Pine Dr
- 190 W Pinewood Ave
- 130 Ponderosa Pine Dr
- 189 W Pinewood Ave
- 111 Ponderosa Pine Dr
- 110 Ponderosa Pine Dr
- 200 W Pinewood Ave
- 201 W Pinewood Ave
- 111 W Pinewood Ave
- 140 W Pinewood Ave
- 100 Ponderosa Pine Dr
- 101 Ponderosa Pine Dr
- 101 W Pinewood Ave
- 211 W Pinewood Ave
- 220 W Pinewood Ave
- 120 W Pinewood Ave