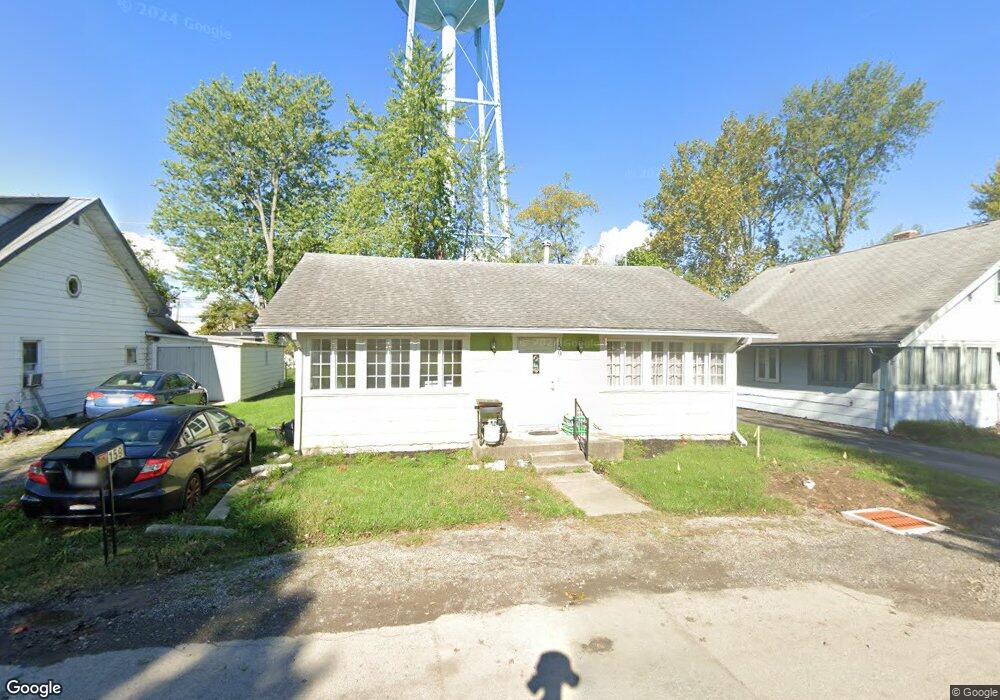
159 Warren Ave Russells Point, OH 43348
Estimated Value: $169,000 - $182,000
2
Beds
1
Bath
1,136
Sq Ft
$156/Sq Ft
Est. Value
About This Home
This home is located at 159 Warren Ave, Russells Point, OH 43348 and is currently estimated at $176,788, approximately $155 per square foot. 159 Warren Ave is a home located in Logan County with nearby schools including Indian Lake Elementary School, Indian Lake Middle School, and Indian Lake High School.
Ownership History
Date
Name
Owned For
Owner Type
Purchase Details
Closed on
Aug 5, 2025
Sold by
Nuance Ventures Qrp Llc
Bought by
Lump Brennon Michael
Current Estimated Value
Home Financials for this Owner
Home Financials are based on the most recent Mortgage that was taken out on this home.
Original Mortgage
$166,840
Outstanding Balance
$166,697
Interest Rate
6.77%
Mortgage Type
New Conventional
Estimated Equity
$10,091
Purchase Details
Closed on
May 28, 2021
Sold by
Wright Dean Edward and Wright Jason Andrew
Bought by
Nuance Ventures Qrp Llc
Purchase Details
Closed on
Sep 23, 2020
Sold by
Wright Carolyn Jane
Bought by
Wright Valerie Paige and Wright Dean Edward
Purchase Details
Closed on
Aug 13, 2014
Sold by
Carolyn Jane Carolyn Jane
Bought by
Wright Valerie Paige and Wright Dean Edward
Purchase Details
Closed on
Oct 8, 2002
Bought by
Wright Carolyn Jane
Purchase Details
Closed on
Oct 29, 1999
Bought by
Winder Christopher Gene
Create a Home Valuation Report for This Property
The Home Valuation Report is an in-depth analysis detailing your home's value as well as a comparison with similar homes in the area
Home Values in the Area
Average Home Value in this Area
Purchase History
| Date | Buyer | Sale Price | Title Company |
|---|---|---|---|
| Lump Brennon Michael | $172,000 | Abstracts Usa | |
| Nuance Ventures Qrp Llc | $60,000 | None Available | |
| Wright Valerie Paige | -- | None Available | |
| Wright Valerie Paige | -- | -- | |
| Wright Carolyn Jane | $21,000 | -- | |
| Winder Christopher Gene | -- | -- |
Source: Public Records
Mortgage History
| Date | Status | Borrower | Loan Amount |
|---|---|---|---|
| Open | Lump Brennon Michael | $166,840 |
Source: Public Records
Tax History Compared to Growth
Tax History
| Year | Tax Paid | Tax Assessment Tax Assessment Total Assessment is a certain percentage of the fair market value that is determined by local assessors to be the total taxable value of land and additions on the property. | Land | Improvement |
|---|---|---|---|---|
| 2024 | $1,053 | $24,070 | $5,610 | $18,460 |
| 2023 | $1,053 | $24,070 | $5,610 | $18,460 |
| 2022 | $1,075 | $20,050 | $4,670 | $15,380 |
| 2021 | $1,015 | $17,260 | $4,670 | $12,590 |
| 2020 | $422 | $15,710 | $3,680 | $12,030 |
| 2019 | $425 | $15,710 | $3,680 | $12,030 |
| 2018 | $346 | $15,710 | $3,680 | $12,030 |
| 2016 | $298 | $14,960 | $3,500 | $11,460 |
| 2014 | $285 | $14,960 | $3,500 | $11,460 |
| 2013 | $355 | $16,910 | $5,450 | $11,460 |
| 2012 | $324 | $16,030 | $2,030 | $14,000 |
Source: Public Records
Map
Nearby Homes
- 208 Clermont Ave
- 222 Warren Ave Unit 3
- 129 Chase Ave Unit 11U
- 285 N Orchard Island Rd Unit lot 66
- 246 N Orchard Island Rd Unit 52
- 241 Chase Ave Unit B-2-U
- 6 Fun Dr
- 213 Russell St
- 222 Park Ave
- 202 Grand Ave
- 130 Sunnyside Ave
- 202 W Main St
- 211 W Main St
- 134 Brads Way
- 0 Towpath Unit 1039398
- 8968 Park St
- 000 Miami Ave
- 8921 Park St
- 8990 Crescent St
- 8959 Crescent St
- 153 Warren Ave
- 163 Warren Ave
- 147 Warren Ave
- 122 Clermont Ave
- 144 Clermont Ave
- 154 Warren Ave
- 201 Warren Ave
- 226 Mansfield St
- 168 Warren Ave
- 143 Warren Ave
- 138 Clermont Ave
- 144 Warren Ave
- 137 Warren Ave
- 153 Clermont Ave
- 161 Burkhart Ave
- 211 Warren Ave
- 159 Clermont Ave
- 202 Warren Ave
- 167 Burkhart Ave
- 149 Clermont Ave