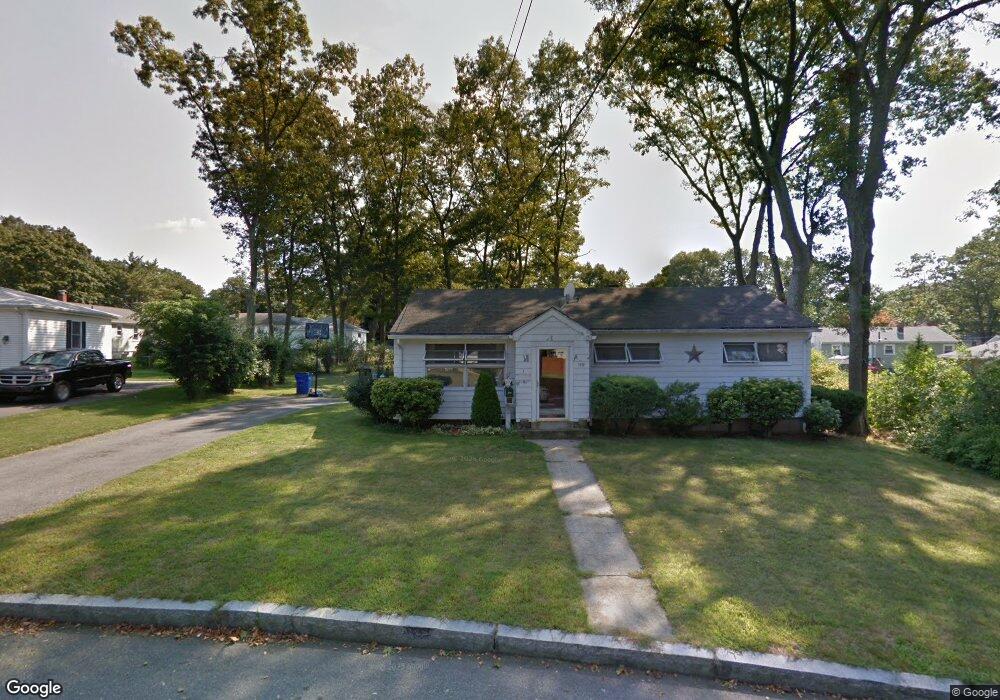
159 Windsor St Fall River, MA 02723
Bank Street NeighborhoodEstimated Value: $368,000 - $454,000
3
Beds
1
Bath
1,020
Sq Ft
$389/Sq Ft
Est. Value
About This Home
This home is located at 159 Windsor St, Fall River, MA 02723 and is currently estimated at $397,170, approximately $389 per square foot. 159 Windsor St is a home located in Bristol County with nearby schools including Mary Fonseca Elementary School, Talbot Innovation School, and B M C Durfee High School.
Ownership History
Date
Name
Owned For
Owner Type
Purchase Details
Closed on
Jun 9, 2016
Sold by
Monsour Derek F and Monsour-Kendrick Pamela A
Bought by
Manchester Cheryl A and Manchester Cory A
Current Estimated Value
Home Financials for this Owner
Home Financials are based on the most recent Mortgage that was taken out on this home.
Original Mortgage
$73,400
Outstanding Balance
$57,956
Interest Rate
3.66%
Mortgage Type
New Conventional
Estimated Equity
$339,214
Create a Home Valuation Report for This Property
The Home Valuation Report is an in-depth analysis detailing your home's value as well as a comparison with similar homes in the area
Home Values in the Area
Average Home Value in this Area
Purchase History
| Date | Buyer | Sale Price | Title Company |
|---|---|---|---|
| Manchester Cheryl A | $77,300 | -- |
Source: Public Records
Mortgage History
| Date | Status | Borrower | Loan Amount |
|---|---|---|---|
| Open | Manchester Cheryl A | $73,400 |
Source: Public Records
Tax History
| Year | Tax Paid | Tax Assessment Tax Assessment Total Assessment is a certain percentage of the fair market value that is determined by local assessors to be the total taxable value of land and additions on the property. | Land | Improvement |
|---|---|---|---|---|
| 2025 | $3,507 | $306,300 | $138,800 | $167,500 |
| 2024 | $3,292 | $286,500 | $133,400 | $153,100 |
| 2023 | $3,189 | $259,900 | $119,800 | $140,100 |
| 2022 | $2,817 | $223,200 | $110,900 | $112,300 |
| 2021 | $2,848 | $205,900 | $104,700 | $101,200 |
| 2020 | $2,759 | $190,900 | $100,800 | $90,100 |
| 2019 | $2,690 | $184,500 | $100,800 | $83,700 |
| 2018 | $2,655 | $181,600 | $100,800 | $80,800 |
| 2017 | $2,520 | $180,000 | $100,800 | $79,200 |
| 2016 | $2,395 | $175,700 | $100,800 | $74,900 |
| 2015 | $2,252 | $172,200 | $94,300 | $77,900 |
| 2014 | $2,166 | $172,200 | $94,300 | $77,900 |
Source: Public Records
Map
Nearby Homes
Your Personal Tour Guide
Ask me questions while you tour the home.