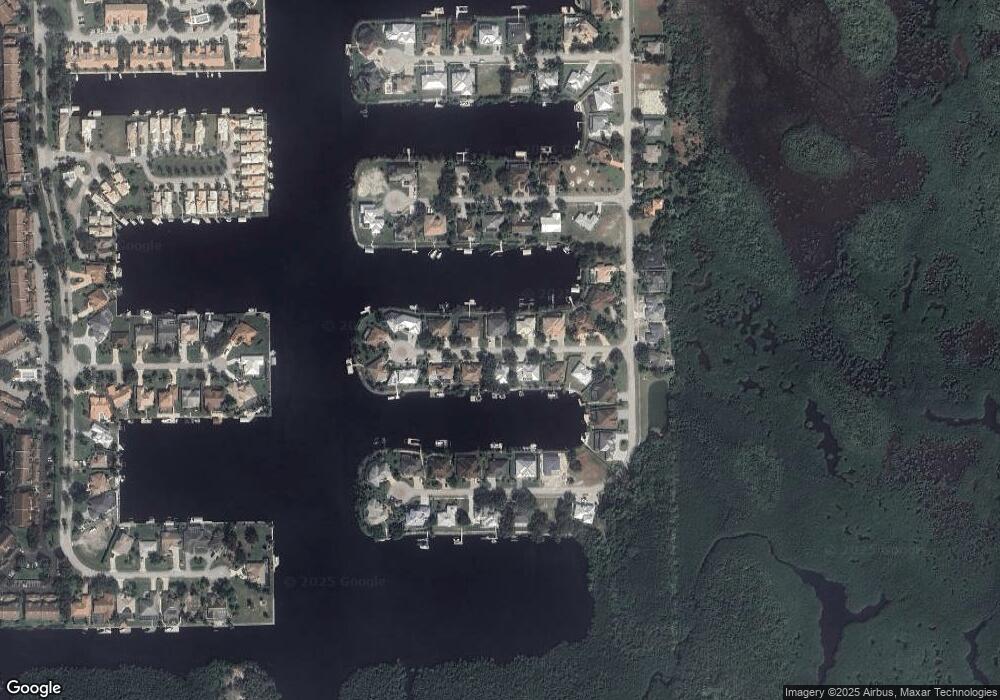
159 Windward Cay Naples, FL 34114
Estimated Value: $1,147,490 - $1,404,000
Studio
--
Bath
2,693
Sq Ft
$474/Sq Ft
Est. Value
About This Home
This home is located at 159 Windward Cay, Naples, FL 34114 and is currently estimated at $1,276,873, approximately $474 per square foot. 159 Windward Cay is a home located in Collier County with nearby schools including Everglades City School.
Ownership History
Date
Name
Owned For
Owner Type
Purchase Details
Closed on
Jan 9, 2025
Sold by
Halden R Deppert Trust and Deppert Curt T
Bought by
Halden R Deppert Marital Trust and Deppert
Current Estimated Value
Purchase Details
Closed on
Aug 9, 2001
Sold by
Zuidema Minert J
Bought by
Deppert Halden R
Purchase Details
Closed on
Mar 14, 2000
Sold by
Ray Jonathan S and Battaglia Joseph T
Bought by
Zuidema Minert J
Purchase Details
Closed on
Jan 21, 1998
Sold by
Ray Kim M
Bought by
Ray Jonathan S
Create a Home Valuation Report for This Property
The Home Valuation Report is an in-depth analysis detailing your home's value as well as a comparison with similar homes in the area
Purchase History
| Date | Buyer | Sale Price | Title Company |
|---|---|---|---|
| Halden R Deppert Marital Trust | -- | None Listed On Document | |
| Halden R Deppert Marital Trust | -- | None Listed On Document | |
| Deppert Halden R | $135,000 | -- | |
| Zuidema Minert J | $55,000 | -- | |
| Ray Jonathan S | -- | -- | |
| Ray Jonathan S | $11,300 | -- |
Source: Public Records
Tax History
| Year | Tax Paid | Tax Assessment Tax Assessment Total Assessment is a certain percentage of the fair market value that is determined by local assessors to be the total taxable value of land and additions on the property. | Land | Improvement |
|---|---|---|---|---|
| 2025 | $13,994 | $911,338 | -- | -- |
| 2024 | $13,362 | $828,489 | -- | -- |
| 2023 | $13,362 | $753,172 | $0 | $0 |
| 2022 | $12,388 | $684,702 | $0 | $0 |
| 2021 | $10,588 | $622,456 | $109,740 | $512,716 |
| 2020 | $10,766 | $619,070 | $125,104 | $493,966 |
| 2019 | $10,421 | $590,847 | $115,008 | $475,839 |
| 2018 | $10,074 | $566,832 | $111,935 | $454,897 |
| 2017 | $10,573 | $579,066 | $122,909 | $456,157 |
| 2016 | $10,517 | $570,824 | $0 | $0 |
| 2015 | $10,310 | $581,155 | $0 | $0 |
| 2014 | $9,504 | $549,142 | $0 | $0 |
Source: Public Records
Map
Nearby Homes
- 162 Windward Cay
- 176 Venus Cay
- 144 Wilderness Cay
- 200 Cays Dr
- 148 Eveningstar Cay
- 111 Morning Star Cay
- 127 Newport Dr
- 123 Newport Dr
- 274 Stella Maris Dr S
- 121 Newport Dr
- 193 Eveningstar Cay
- 269 Sunrise Cay Unit 4
- 314 Stella Maris Dr S
- 249 Stella Maris Dr S
- 182 Newport Dr Unit 1007
- 182 Newport Dr Unit 1003
- 317 Sunrise Cay Unit 103
- 155 Windward Cay
- 163 Windward Cay
- 158 Windward Cay
- 0 158 Windward
- 167 Cays Dr
- 151 Windward Cay
- 154 Windward Cay
- 150 Windward Cay
- 147 Windward Cay
- 175 Cays Dr
- 146 Windward Cay
- 172 Venus Cay Unit 57
- 172 Venus Cay
- 164 Cays Dr
- 168 Cays Dr
- 168 Venus Cay
- 157 Cays Dr
- 160 Cays Dr
- 172 Cays Dr
- 143 Windward Cay
