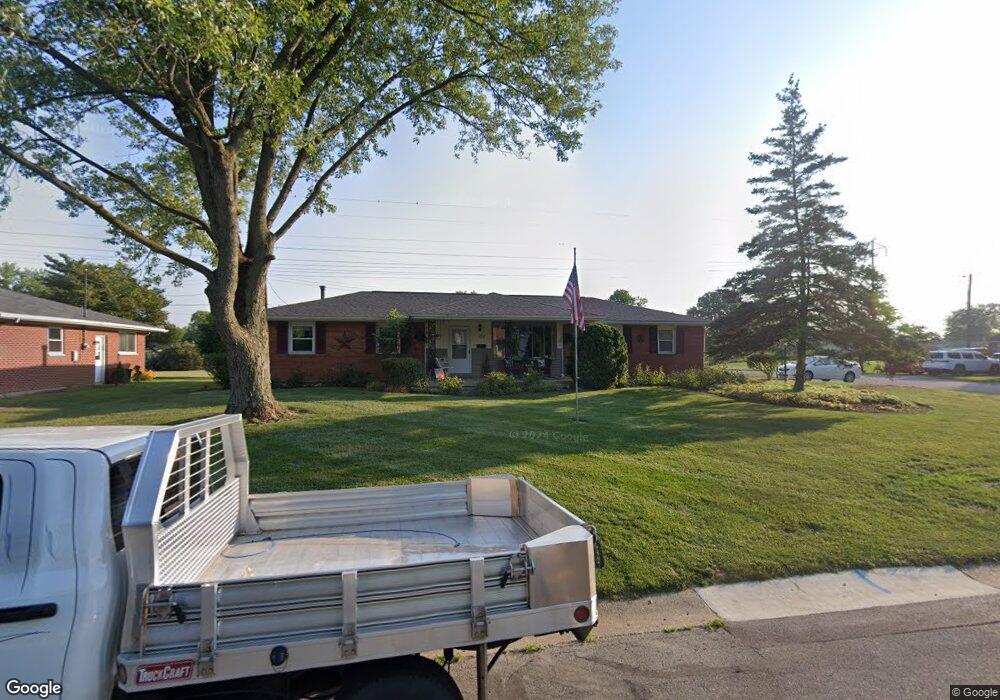
159 Winston Ln Monroe, OH 45050
Estimated Value: $238,278 - $293,000
3
Beds
2
Baths
1,161
Sq Ft
$235/Sq Ft
Est. Value
About This Home
This home is located at 159 Winston Ln, Monroe, OH 45050 and is currently estimated at $273,320, approximately $235 per square foot. 159 Winston Ln is a home located in Butler County with nearby schools including Monroe Primary School, Monroe Elementary School, and Monroe Junior High School.
Ownership History
Date
Name
Owned For
Owner Type
Purchase Details
Closed on
Mar 11, 2002
Sold by
Brinkman Michael L and Brinkman Dahlia J
Bought by
Hale Tony L and Hale Melissa J
Current Estimated Value
Home Financials for this Owner
Home Financials are based on the most recent Mortgage that was taken out on this home.
Original Mortgage
$100,000
Interest Rate
7.11%
Mortgage Type
Purchase Money Mortgage
Purchase Details
Closed on
May 16, 2001
Sold by
Curtis Paul E and Curtis Mary L
Bought by
Brinkman Michael L and Brinkman Dahlia J
Home Financials for this Owner
Home Financials are based on the most recent Mortgage that was taken out on this home.
Original Mortgage
$123,018
Interest Rate
7.02%
Mortgage Type
FHA
Purchase Details
Closed on
Sep 7, 1995
Sold by
Henderson Steven M
Bought by
Curtis Paul E and Curtis Mary
Home Financials for this Owner
Home Financials are based on the most recent Mortgage that was taken out on this home.
Original Mortgage
$107,567
Interest Rate
7.76%
Mortgage Type
FHA
Purchase Details
Closed on
Jun 1, 1992
Create a Home Valuation Report for This Property
The Home Valuation Report is an in-depth analysis detailing your home's value as well as a comparison with similar homes in the area
Home Values in the Area
Average Home Value in this Area
Purchase History
| Date | Buyer | Sale Price | Title Company |
|---|---|---|---|
| Hale Tony L | $128,500 | -- | |
| Brinkman Michael L | $124,000 | -- | |
| Curtis Paul E | $108,000 | -- | |
| -- | $98,900 | -- |
Source: Public Records
Mortgage History
| Date | Status | Borrower | Loan Amount |
|---|---|---|---|
| Closed | Hale Tony L | $100,000 | |
| Closed | Brinkman Michael L | $123,018 | |
| Closed | Curtis Paul E | $107,567 |
Source: Public Records
Tax History
| Year | Tax Paid | Tax Assessment Tax Assessment Total Assessment is a certain percentage of the fair market value that is determined by local assessors to be the total taxable value of land and additions on the property. | Land | Improvement |
|---|---|---|---|---|
| 2025 | $3,470 | $71,170 | $13,030 | $58,140 |
| 2024 | $3,470 | $71,170 | $13,030 | $58,140 |
| 2023 | $3,395 | $71,640 | $13,030 | $58,610 |
| 2022 | $10,199 | $52,880 | $13,030 | $39,850 |
| 2021 | $2,799 | $52,880 | $13,030 | $39,850 |
| 2020 | $2,891 | $52,880 | $13,030 | $39,850 |
| 2019 | $2,876 | $41,950 | $12,730 | $29,220 |
| 2018 | $2,506 | $41,950 | $12,730 | $29,220 |
| 2017 | $2,343 | $41,950 | $12,730 | $29,220 |
| 2016 | $2,459 | $38,580 | $12,730 | $25,850 |
| 2015 | $2,223 | $38,580 | $12,730 | $25,850 |
| 2014 | $2,358 | $38,580 | $12,730 | $25,850 |
| 2013 | $2,358 | $40,410 | $12,730 | $27,680 |
Source: Public Records
Map
Nearby Homes
- 921 Heritage Green Dr Unit 9302
- 1753 Weatherstone Cir Unit 13G6
- 360 Britton Ln
- 195 Brittony Woods Dr
- 852 Willowbrook Dr
- 345 Sunset Ct
- 100 N Main St
- 32 W Elm St
- 856 Hocking Meadow Cir
- 75 Teil Tree Ct
- 47 Ethel Dr
- 132 Village Ct
- 6893 Gaspar Trail
- 155 Keswick Dr
- 513 Austin Smith Dr
- 15 Old Orchard Ln
- 320 Bridle Pass Way
- 329 Ridgeview Ln
- 916 S Main St
- 965 Rustic Ct
- 155 Winston Ln
- 411 Doverdale Dr
- 404 Doverdale Dr
- 151 Winston Ln
- 156 Wexford Dr
- 158 Winston Ln
- 166 Wexford Dr
- 415 Doverdale Dr
- 152 Wexford Dr
- 154 Winston Ln
- 147 Winston Ln
- 148 Wexford Dr
- 170 Wexford Dr
- 424 Doverdale Dr
- 423 Doverdale Dr
- 141 Winston Ln
- 146 Winston Ln
- 144 Wexford Dr
- 144 Wexford Dr Unit 1603
- 176 Wexford Dr
Your Personal Tour Guide
Ask me questions while you tour the home.