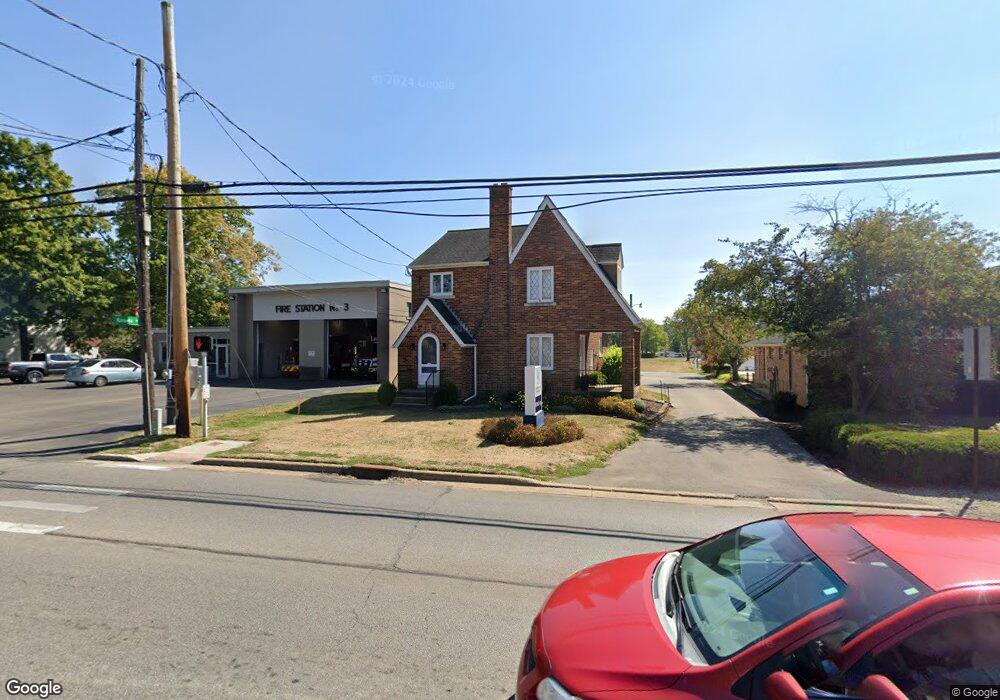
1590 E Main St Lancaster, OH 43130
--
Bed
--
Bath
1,564
Sq Ft
43,560
Sq Ft Lot
About This Home
This home is located at 1590 E Main St, Lancaster, OH 43130. 1590 E Main St is a home located in Fairfield County with nearby schools including Thomas Ewing Junior High School, Lancaster High School, and St Bernadette Elementary School.
Create a Home Valuation Report for This Property
The Home Valuation Report is an in-depth analysis detailing your home's value as well as a comparison with similar homes in the area
Home Values in the Area
Average Home Value in this Area
Tax History
| Year | Tax Paid | Tax Assessment Tax Assessment Total Assessment is a certain percentage of the fair market value that is determined by local assessors to be the total taxable value of land and additions on the property. | Land | Improvement |
|---|---|---|---|---|
| 2024 | -- | $84,110 | $67,200 | $16,910 |
| 2023 | -- | $84,110 | $67,200 | $16,910 |
| 2022 | $0 | $85,140 | $67,200 | $17,940 |
| 2021 | $0 | $85,140 | $67,200 | $17,940 |
| 2020 | $0 | $85,140 | $67,200 | $17,940 |
| 2019 | $0 | $92,080 | $74,140 | $17,940 |
| 2018 | $0 | $96,100 | $78,330 | $17,770 |
| 2017 | $0 | $58,090 | $40,320 | $17,770 |
| 2016 | $0 | $58,090 | $40,320 | $17,770 |
| 2015 | -- | $58,090 | $40,320 | $17,770 |
| 2014 | -- | $58,090 | $40,320 | $17,770 |
| 2013 | -- | $58,090 | $40,320 | $17,770 |
Source: Public Records
Map
Nearby Homes
- 0 E Main St Unit 225040917
- 274 Kanawha Rd
- 1020 Sycamore Dr
- 1403 E Chestnut St
- 138 N Ewing St
- 105 Dogwood Ln
- 1066 Lanreco Blvd
- 403 S Ewing St
- 1376 Frederick St
- 1281 E Allen St
- 1106 E Walnut St
- 1113 E Locust St
- 630 Sheridan Dr
- 627 Sheridan Dr
- 641 Sheridan Dr
- 1254 E Fair Ave
- 869 E Mulberry St
- 621 Harding Ave
- 859 E Mulberry St
- 844 E Wheeling St
- 1568 E Main St
- 1572 E Main St
- 1572 E Main St Unit Lot 33
- 1620 E Main St
- 1565 E Main St
- 117 Kanawha Rd
- 118 Kanawha Rd
- 1571 E Main St
- 1610 E Main St
- 1622 E Main St
- 1624 E Main St
- 1569 E Main St
- 123 Kanawha Rd
- 0 E Main St Unit 9914137
- 0 E Main St Unit 9917690
- 0 E Main St Unit 2710975
- 0 E Main St Unit 2652612
- 0 E Main St Unit 2720804
- 0 E Main St Unit 2501128
- 0 E Main St Unit 2439823
Your Personal Tour Guide
Ask me questions while you tour the home.