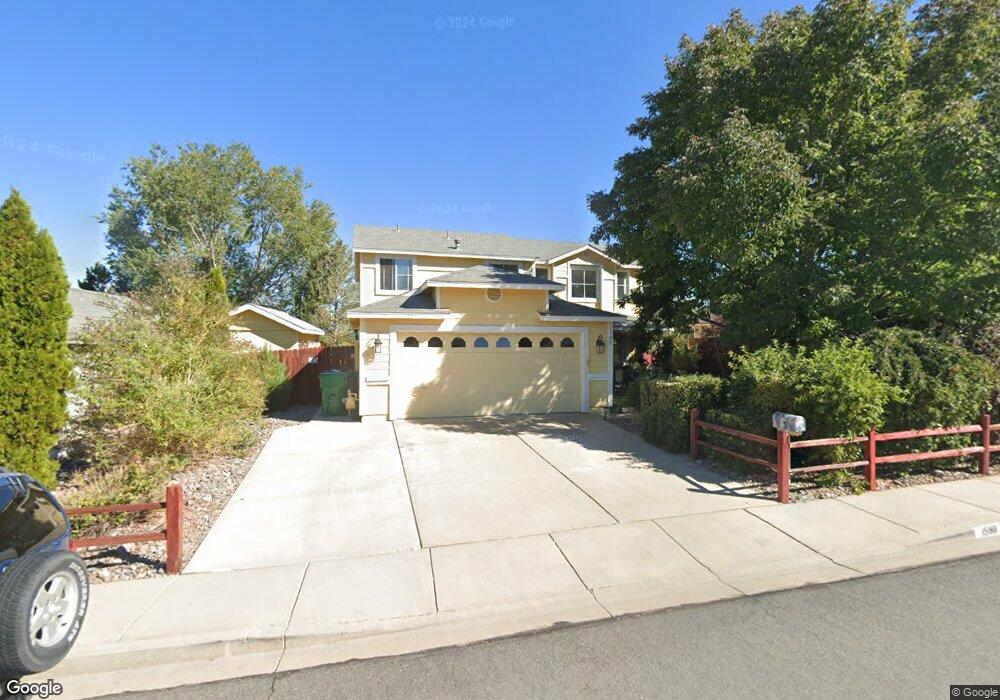
1590 Mescalero Ave Reno, NV 89523
Northgate NeighborhoodEstimated Value: $568,634 - $607,000
3
Beds
3
Baths
1,631
Sq Ft
$360/Sq Ft
Est. Value
About This Home
This home is located at 1590 Mescalero Ave, Reno, NV 89523 and is currently estimated at $586,409, approximately $359 per square foot. 1590 Mescalero Ave is a home located in Washoe County with nearby schools including B D Billinghurst Middle School, Robert McQueen High School, and Riverview Christian Academy.
Ownership History
Date
Name
Owned For
Owner Type
Purchase Details
Closed on
Dec 7, 2004
Sold by
Leone Robert A and Leone Shannon
Bought by
Rogers William R and Rogers Elizabeth M
Current Estimated Value
Home Financials for this Owner
Home Financials are based on the most recent Mortgage that was taken out on this home.
Original Mortgage
$292,000
Outstanding Balance
$145,357
Interest Rate
5.64%
Mortgage Type
Stand Alone First
Estimated Equity
$441,052
Purchase Details
Closed on
Sep 30, 1998
Sold by
Houston Phyllis M
Bought by
Leone Robert A
Home Financials for this Owner
Home Financials are based on the most recent Mortgage that was taken out on this home.
Original Mortgage
$138,000
Interest Rate
6.88%
Purchase Details
Closed on
Mar 27, 1997
Sold by
Bailey and Bailey Mcgah
Bought by
Houston Phyllis M
Home Financials for this Owner
Home Financials are based on the most recent Mortgage that was taken out on this home.
Original Mortgage
$122,000
Interest Rate
7.63%
Create a Home Valuation Report for This Property
The Home Valuation Report is an in-depth analysis detailing your home's value as well as a comparison with similar homes in the area
Home Values in the Area
Average Home Value in this Area
Purchase History
| Date | Buyer | Sale Price | Title Company |
|---|---|---|---|
| Rogers William R | $365,000 | Western Title Incorporated | |
| Leone Robert A | $158,000 | Stewart Title | |
| Houston Phyllis M | $153,000 | Stewart Title |
Source: Public Records
Mortgage History
| Date | Status | Borrower | Loan Amount |
|---|---|---|---|
| Open | Rogers William R | $292,000 | |
| Previous Owner | Leone Robert A | $138,000 | |
| Previous Owner | Houston Phyllis M | $122,000 |
Source: Public Records
Tax History Compared to Growth
Tax History
| Year | Tax Paid | Tax Assessment Tax Assessment Total Assessment is a certain percentage of the fair market value that is determined by local assessors to be the total taxable value of land and additions on the property. | Land | Improvement |
|---|---|---|---|---|
| 2025 | $2,777 | $100,882 | $36,645 | $64,237 |
| 2024 | $2,777 | $96,480 | $31,360 | $65,120 |
| 2023 | $2,620 | $95,393 | $35,700 | $59,693 |
| 2022 | $2,544 | $78,744 | $29,050 | $49,694 |
| 2021 | $2,470 | $73,648 | $24,010 | $49,638 |
| 2020 | $2,395 | $72,672 | $22,750 | $49,922 |
| 2019 | $2,327 | $71,052 | $22,400 | $48,652 |
| 2018 | $2,260 | $64,598 | $16,765 | $47,833 |
| 2017 | $2,194 | $63,684 | $15,645 | $48,039 |
| 2016 | $2,140 | $62,122 | $13,265 | $48,857 |
| 2015 | $2,136 | $61,004 | $11,900 | $49,104 |
| 2014 | $2,073 | $56,713 | $9,310 | $47,403 |
| 2013 | -- | $54,782 | $8,015 | $46,767 |
Source: Public Records
Map
Nearby Homes
- 6811 Sonterra Ln
- 1055 Udowski Unit Homesite 53
- 1025 Udowski Unit Homesite 56
- 0 Unit 250003854
- 6673 Enchanted Valley Dr
- 1410 Crosswater Dr
- 7350 Austin Creek Ct
- 1664 Shadow Wood Rd
- 1585 Springfield Park Dr Unit 16G
- 1836 Cambridge Hills Ct
- 6440 Enchanted Valley Dr
- 7150 Crosswater Ct
- 1651 Ashbury Ln
- 2014 Cradle Mountain Dr Unit 2
- 6460 Valley Wood Dr
- 6339 Park Place
- 6310 Park Place
- 2163 3 Wood Ln
- 6338 Chesterfield Ln
- 6850 Sharlands Ave Unit Q1095
- 1580 Mescalero Ave
- 1600 Mescalero Ave
- 6798 Alicante Ct
- 1570 Mescalero Ave
- 1605 Mescalero Ave
- 1595 Mescalero Ave
- 1615 Mescalero Ave
- 6788 Alicante Ct
- 1625 Mescalero Ave
- 1560 Mescalero Ave
- 6789 Alicante Ct
- 6779 Alicante Ct
- 6799 Alicante Ct
- 1635 Mescalero Ave
- 6769 Alicante Ct
- 1585 Mescalero Ave
- 6778 Alicante Ct
- 1575 Mescalero Ave
- 6759 Alicante Ct
- 1550 Mescalero Ave