Estimated Value: $80,000 - $589,000
4
Beds
3
Baths
3,515
Sq Ft
$100/Sq Ft
Est. Value
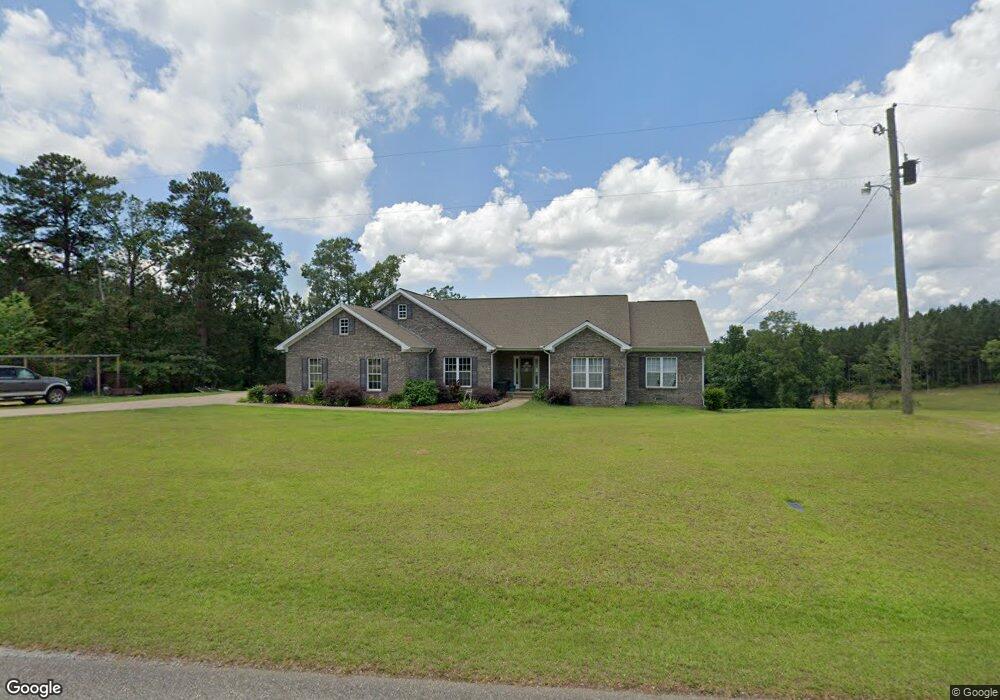
About This Home
This home is located at 15900 Jackson Trace Rd, Coker, AL 35452 and is currently estimated at $351,333, approximately $99 per square foot. 15900 Jackson Trace Rd is a home located in Tuscaloosa County with nearby schools including Walker Elementary School, Northside Middle School, and Northside High School.
Ownership History
Date
Name
Owned For
Owner Type
Purchase Details
Closed on
Nov 8, 2022
Sold by
Hindman Surveying Llc
Bought by
Hindman Surveying Llc
Current Estimated Value
Purchase Details
Closed on
Aug 4, 2017
Sold by
Nelson Michael T
Bought by
Hindman Blake M and Hindman Kaci L
Home Financials for this Owner
Home Financials are based on the most recent Mortgage that was taken out on this home.
Original Mortgage
$180,000
Interest Rate
3.96%
Mortgage Type
New Conventional
Purchase Details
Closed on
May 29, 2007
Sold by
Stimac Construction Llc
Bought by
Nelson Michael T
Home Financials for this Owner
Home Financials are based on the most recent Mortgage that was taken out on this home.
Original Mortgage
$265,345
Interest Rate
6.17%
Purchase Details
Closed on
Dec 29, 2006
Sold by
Not Provided
Bought by
Nelson Michael T and Nelson Carol O
Purchase Details
Closed on
Nov 1, 2006
Sold by
Sullivan Company Llc
Bought by
Nelson Michael and Nelson Carol
Create a Home Valuation Report for This Property
The Home Valuation Report is an in-depth analysis detailing your home's value as well as a comparison with similar homes in the area
Purchase History
| Date | Buyer | Sale Price | Title Company |
|---|---|---|---|
| Hindman Surveying Llc | $90,000 | -- | |
| Hindman Surveying Llc | $90,000 | None Listed On Document | |
| Hindman Blake M | $245,000 | -- | |
| Nelson Michael T | $286,845 | -- | |
| Nelson Michael T | -- | -- | |
| Nelson Michael | $25,000 | -- |
Source: Public Records
Mortgage History
| Date | Status | Borrower | Loan Amount |
|---|---|---|---|
| Previous Owner | Hindman Blake M | $180,000 | |
| Previous Owner | Nelson Michael T | $231,000 | |
| Previous Owner | Nelson Michael T | $265,345 |
Source: Public Records
Tax History
| Year | Tax Paid | Tax Assessment Tax Assessment Total Assessment is a certain percentage of the fair market value that is determined by local assessors to be the total taxable value of land and additions on the property. | Land | Improvement |
|---|---|---|---|---|
| 2024 | $1,610 | $92,240 | $10,060 | $82,180 |
| 2023 | $1,610 | $88,180 | $5,000 | $83,180 |
| 2022 | $1,332 | $75,880 | $5,000 | $70,880 |
| 2021 | $1,219 | $69,760 | $5,000 | $64,760 |
| 2020 | $1,054 | $30,420 | $2,500 | $27,920 |
| 2019 | $1,054 | $30,420 | $2,500 | $27,920 |
| 2018 | $1,054 | $30,420 | $2,500 | $27,920 |
| 2017 | $1,058 | $0 | $0 | $0 |
| 2016 | $1,054 | $0 | $0 | $0 |
| 2015 | $1,054 | $0 | $0 | $0 |
| 2014 | -- | $30,440 | $2,500 | $27,940 |
Source: Public Records
Map
Nearby Homes
- 0 Bethabara Rd Unit 173420
- 16020 Northwind Cir
- 15919 Northwind Cir
- 14109 Prewitt Loop Rd
- 15174 Green Cir
- 12796 Lakeland Hills Dr
- 00 Starboard Place
- 12499 Rising Tide
- 16271 Pine Lake Rd
- 8 Holly Rd Unit 8
- 16246 Holly Springs Rd
- 8 Holly Springs Rd
- 16375 Holly Springs Rd
- 18263 Mormon Rd
- 16584 Kathryn Lane Dr
- 15319 Marina Dr
- 15479 Choctaw Trail
- 14275 Watercolor Dr
- 0 Orlea Ln Unit 25877709
- 13074 Alla Dr
- 15825 Jackson Trace Rd
- 15895 Jackson Trace Rd
- 15992 Jackson Trace Rd
- 15799 Highway 171
- 14840 Bone Camp Rd
- 15863 Highway 171
- 15721 Highway 171
- 15695 Highway 171
- 16440 Hobson Cut Off Rd
- 15053 Blue Willow Ln
- 14947 Blue Willow Ln
- 15669 Highway 171
- 14770 Bone Camp Rd
- 16018 Highway 171
- 15505 Jackson Trace Rd
- 15120 Bethabara Rd
- 19794 Dundee Dr
- 15100 Bethabara Rd
- 15822 Dundee Dr
- 14779 Bone Camp Rd
Your Personal Tour Guide
Ask me questions while you tour the home.