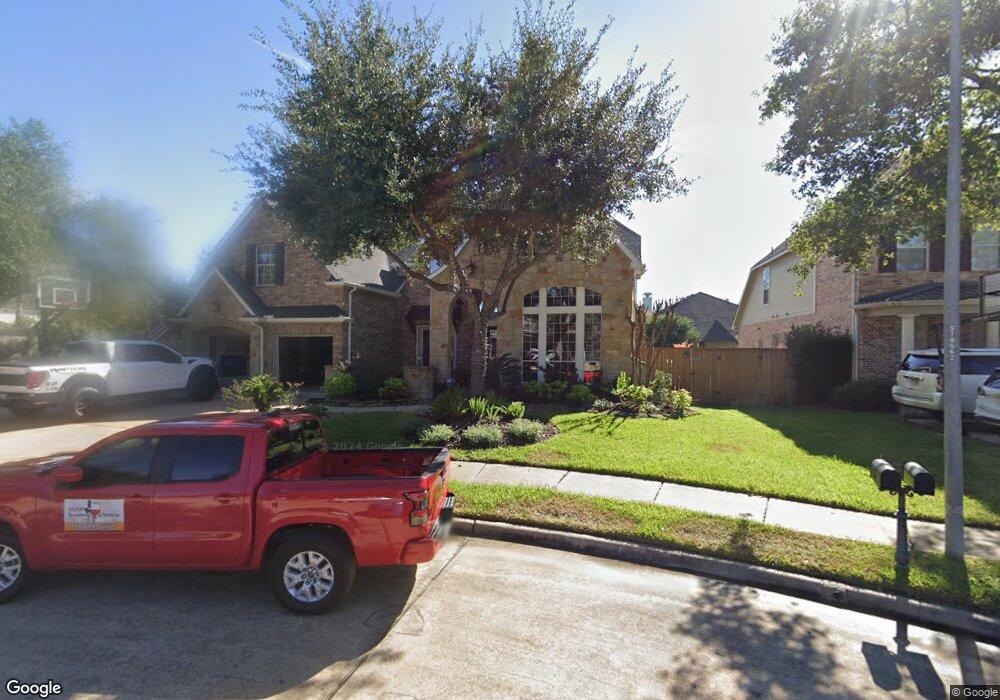
15903 Aster Manor Ct Cypress, TX 77429
Estimated Value: $580,000 - $603,429
4
Beds
4
Baths
3,758
Sq Ft
$158/Sq Ft
Est. Value
About This Home
This home is located at 15903 Aster Manor Ct, Cypress, TX 77429 and is currently estimated at $594,607, approximately $158 per square foot. 15903 Aster Manor Ct is a home located in Harris County with nearby schools including Sampson Elementary School, Spillane Middle School, and Cypress Woods High School.
Ownership History
Date
Name
Owned For
Owner Type
Purchase Details
Closed on
Aug 13, 2025
Sold by
Stuart Living Trust and Stuart Ryan T
Bought by
Stuart Ryan T and Stuart Jaime L
Current Estimated Value
Home Financials for this Owner
Home Financials are based on the most recent Mortgage that was taken out on this home.
Original Mortgage
$525,600
Outstanding Balance
$525,137
Interest Rate
6.63%
Mortgage Type
Credit Line Revolving
Estimated Equity
$69,470
Purchase Details
Closed on
Aug 22, 2024
Sold by
Stuart Ryan T and Stuart Jaime L
Bought by
Stuart Jaime L and Stuart Living Trust
Purchase Details
Closed on
Apr 28, 2005
Sold by
Weekley Homes Lp
Bought by
Stuart Ryan and Stuart Jaime
Home Financials for this Owner
Home Financials are based on the most recent Mortgage that was taken out on this home.
Original Mortgage
$299,175
Interest Rate
5.93%
Mortgage Type
Fannie Mae Freddie Mac
Purchase Details
Closed on
Nov 26, 2004
Sold by
Jdc/Greenleaf Ltd
Bought by
Weekley Homes Lp
Create a Home Valuation Report for This Property
The Home Valuation Report is an in-depth analysis detailing your home's value as well as a comparison with similar homes in the area
Home Values in the Area
Average Home Value in this Area
Purchase History
| Date | Buyer | Sale Price | Title Company |
|---|---|---|---|
| Stuart Ryan T | -- | None Listed On Document | |
| Stuart Jaime L | -- | None Listed On Document | |
| Stuart Ryan | -- | Alamo Title Company | |
| Weekley Homes Lp | -- | Priority Title Company |
Source: Public Records
Mortgage History
| Date | Status | Borrower | Loan Amount |
|---|---|---|---|
| Open | Stuart Ryan T | $525,600 | |
| Previous Owner | Stuart Ryan | $299,175 |
Source: Public Records
Tax History Compared to Growth
Tax History
| Year | Tax Paid | Tax Assessment Tax Assessment Total Assessment is a certain percentage of the fair market value that is determined by local assessors to be the total taxable value of land and additions on the property. | Land | Improvement |
|---|---|---|---|---|
| 2025 | $8,756 | $580,146 | $107,513 | $472,633 |
| 2024 | $8,756 | $538,241 | $97,782 | $440,459 |
| 2023 | $8,756 | $586,130 | $97,782 | $488,348 |
| 2022 | $10,955 | $494,117 | $69,976 | $424,141 |
| 2021 | $10,578 | $417,923 | $69,976 | $347,947 |
| 2020 | $10,394 | $398,342 | $56,916 | $341,426 |
| 2019 | $10,644 | $395,589 | $56,916 | $338,673 |
| 2018 | $4,042 | $382,144 | $56,916 | $325,228 |
| 2017 | $10,285 | $382,144 | $56,916 | $325,228 |
| 2016 | $10,751 | $399,459 | $56,916 | $342,543 |
| 2015 | $8,057 | $399,459 | $56,916 | $342,543 |
| 2014 | $8,057 | $399,459 | $56,916 | $342,543 |
Source: Public Records
Map
Nearby Homes
- 15922 Clipper Pointe Dr
- 13926 Wessex Park Dr
- 14210 Northface Manor Ct
- 14126 Bloomingdale Manor Dr
- 13002 Huffmeister Rd
- 15923 Hurstfield Pointe Dr
- 14103 Sherburn Manor Dr
- 14207 Spindle Arbor Rd
- 13718 Sherburn Manor Dr
- 0 Maxwell Rd Unit 67788253
- 14555 Cypress North Houston
- 14210 Prospect Point Dr
- 16211 Halpren Falls Ln
- 14306 Medlowe Ct
- 14807 Providence Manor Way
- 14539 Gleaming Rose Dr
- 14442 Gleaming Rose Dr
- 16219 Haden Crest Ct
- 14906 Stonemeade Place
- 13703 Layton Hills Dr
- 15907 Aster Manor Ct
- 15942 Clipper Pointe Dr
- 14034 Ashland Landing Dr
- 14035 Conner Park Dr
- 15938 Clipper Pointe Dr
- 14030 Ashland Landing Dr
- 13315 Ashland Landing Dr
- 13319 Ashland Landing Dr
- 15902 Aster Manor Ct
- 15906 Aster Manor Ct
- 14031 Conner Park Dr
- 14026 Ashland Landing Dr
- 14103 Ashland Landing Dr
- 15934 Clipper Pointe Dr
- 14107 Ashland Landing Dr
- 14031 Ashland Landing Dr
- 14111 Ashland Landing Dr
- 14118 Ashland Landing Dr
- 14027 Conner Park Dr
- 15930 Clipper Pointe Dr