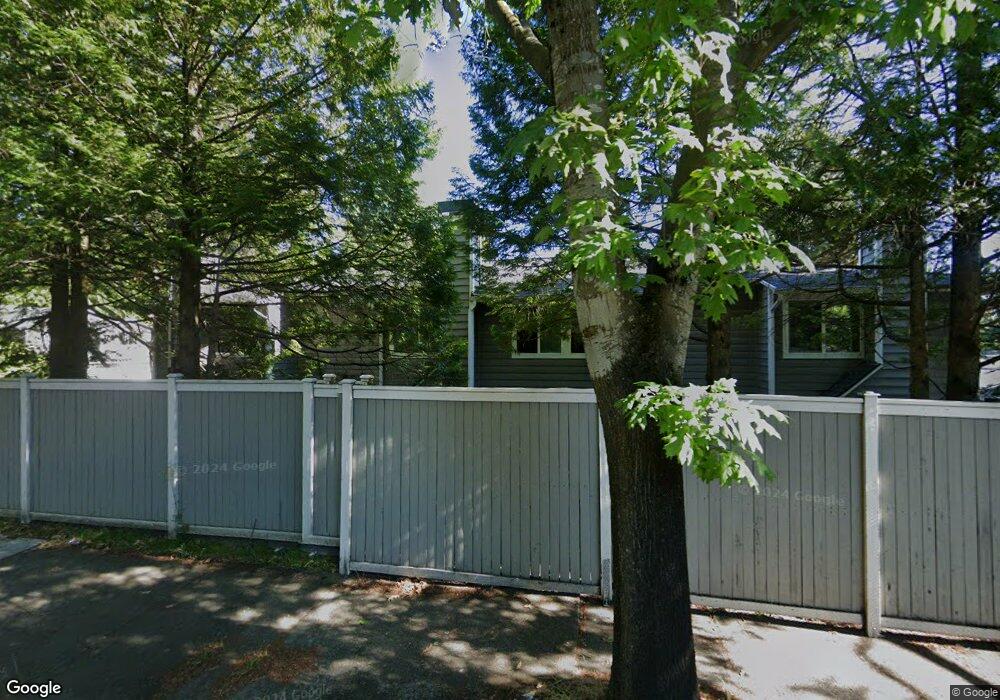
15903 NE 40th Way Unit 31B Redmond, WA 98052
Overlake NeighborhoodEstimated Value: $745,000 - $817,918
3
Beds
3
Baths
1,359
Sq Ft
$580/Sq Ft
Est. Value
About This Home
This home is located at 15903 NE 40th Way Unit 31B, Redmond, WA 98052 and is currently estimated at $788,480, approximately $580 per square foot. 15903 NE 40th Way Unit 31B is a home located in King County with nearby schools including John J. Audubon Elementary School, Rose Hill Middle School, and Lake Washington High School.
Ownership History
Date
Name
Owned For
Owner Type
Purchase Details
Closed on
Apr 12, 2013
Sold by
Cain David E and Sweeney Martha
Bought by
Parashar Peeyush S and Parashar Rashmi P
Current Estimated Value
Home Financials for this Owner
Home Financials are based on the most recent Mortgage that was taken out on this home.
Original Mortgage
$252,800
Outstanding Balance
$178,765
Interest Rate
3.51%
Estimated Equity
$609,715
Purchase Details
Closed on
Jan 15, 2009
Sold by
Cain David E
Bought by
Cain David E and Sweeney Martha
Home Financials for this Owner
Home Financials are based on the most recent Mortgage that was taken out on this home.
Original Mortgage
$160,000
Interest Rate
5.14%
Purchase Details
Closed on
Feb 9, 2005
Sold by
Ross Richard A
Bought by
Cain David E
Home Financials for this Owner
Home Financials are based on the most recent Mortgage that was taken out on this home.
Original Mortgage
$200,000
Interest Rate
4.87%
Purchase Details
Closed on
Aug 18, 1988
Sold by
Centron Development Corporatio
Bought by
Ross Richard A
Create a Home Valuation Report for This Property
The Home Valuation Report is an in-depth analysis detailing your home's value as well as a comparison with similar homes in the area
Home Values in the Area
Average Home Value in this Area
Purchase History
| Date | Buyer | Sale Price | Title Company |
|---|---|---|---|
| Parashar Peeyush S | $316,000 | Chicago Title | |
| Cain David E | -- | Rainier Title | |
| Cain David E | $250,000 | Old Republic T | |
| Ross Richard A | $88,200 | -- |
Source: Public Records
Mortgage History
| Date | Status | Borrower | Loan Amount |
|---|---|---|---|
| Open | Parashar Peeyush S | $252,800 | |
| Previous Owner | Cain David E | $160,000 | |
| Previous Owner | Cain David E | $200,000 |
Source: Public Records
Tax History Compared to Growth
Tax History
| Year | Tax Paid | Tax Assessment Tax Assessment Total Assessment is a certain percentage of the fair market value that is determined by local assessors to be the total taxable value of land and additions on the property. | Land | Improvement |
|---|---|---|---|---|
| 2024 | $5,801 | $737,000 | $151,900 | $585,100 |
| 2023 | $5,017 | $818,000 | $151,900 | $666,100 |
| 2022 | $5,280 | $681,000 | $151,900 | $529,100 |
| 2021 | $5,368 | $613,000 | $151,900 | $461,100 |
| 2020 | $5,394 | $576,000 | $151,900 | $424,100 |
| 2018 | $4,271 | $520,000 | $114,700 | $405,300 |
| 2017 | $3,491 | $427,000 | $108,000 | $319,000 |
| 2016 | $3,147 | $364,000 | $104,600 | $259,400 |
| 2015 | $3,370 | $325,000 | $87,700 | $237,300 |
| 2014 | -- | $336,000 | $74,200 | $261,800 |
| 2013 | -- | $246,000 | $74,200 | $171,800 |
Source: Public Records
Map
Nearby Homes
- 16375 NE 44th Ct
- 16409 NE 43rd Ct
- 15810 NE 49th St
- 16629 NE 46th St
- 14651 NE 40th St Unit G1
- 14527 NE 40th St Unit G204
- 14527 NE 40th St Unit G104
- 14547 NE 40th St Unit J302
- 17301 NE 45th St Unit 88
- 14665 NE 34th St Unit B-13
- 14665 NE 34th St Unit B22
- 17106 NE 31st Place
- 5733 155th Ave NE
- 14435 NE 40th St Unit B101
- 17442 NE 40th Place Unit D3
- 17440 NE 38th St Unit A201
- 5858 156th Ave NE
- 15525 NE 60th St
- 14606 NE 51st St Unit C7
- 3834 175th Ave NE Unit E49
- 15903 NE 40th Way
- 15904 NE 40th Way Unit 29B
- 15908 NE 40th Way
- 15908 NE 40th Way Unit 29D
- 15900 NE 40th Way Unit 26B
- 15900 NE 40th Way Unit 27B
- 15900 NE 40th Way Unit 26A
- 15900 NE 40th Way Unit 29B
- 15900 NE 40th Way Unit 32B
- 15900 NE 40th Way Unit 28B
- 15900 NE 40th Way Unit 27A
- 15900 NE 40th Way Unit 31C
- 15900 NE 40th Way Unit 32A
- 15900 NE 40th Way Unit 32C
- 15900 NE 40th Way Unit 31B
- 15900 NE 40th Way Unit 31A
- 15900 NE 40th Way Unit 30B
- 15900 NE 40th Way Unit 30A
- 15900 NE 40th Way Unit 29D
- 15900 NE 40th Way Unit 29C