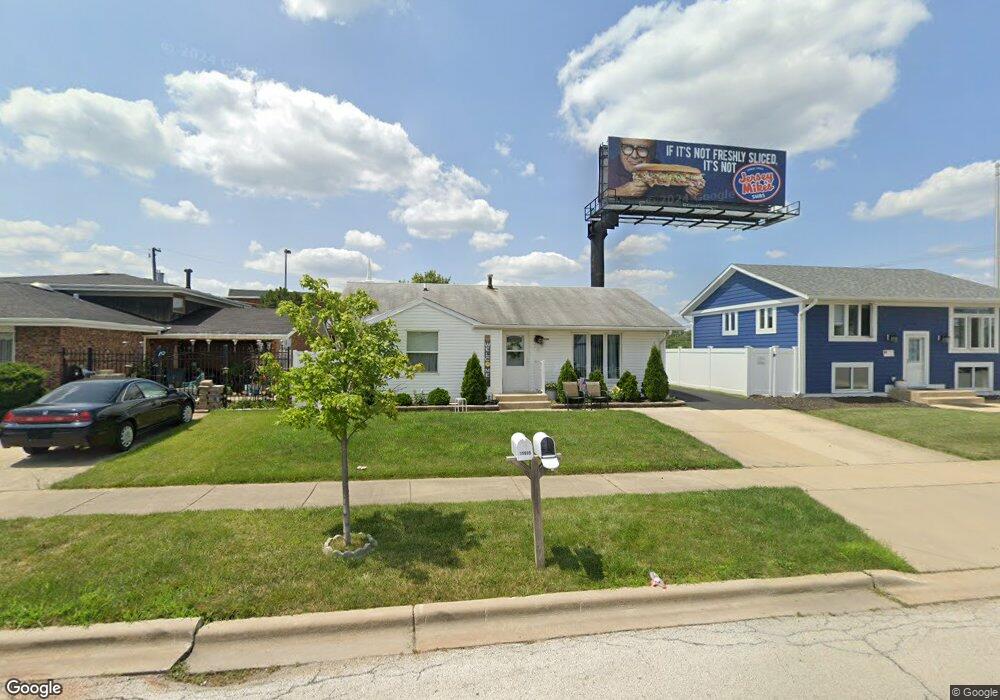
15908 Haven Ave Orland Hills, IL 60487
Estimated Value: $230,000 - $258,000
3
Beds
1
Bath
964
Sq Ft
$259/Sq Ft
Est. Value
About This Home
This home is located at 15908 Haven Ave, Orland Hills, IL 60487 and is currently estimated at $249,353, approximately $258 per square foot. 15908 Haven Ave is a home located in Cook County with nearby schools including Orland Center School, Liberty Elementary School, and Jerling Junior High School.
Ownership History
Date
Name
Owned For
Owner Type
Purchase Details
Closed on
Nov 6, 1998
Sold by
Kapala John M and Kapala Jodi L
Bought by
Rayburn Johnny D and Rayburn Doris F
Current Estimated Value
Home Financials for this Owner
Home Financials are based on the most recent Mortgage that was taken out on this home.
Original Mortgage
$94,400
Outstanding Balance
$19,624
Interest Rate
6.59%
Estimated Equity
$229,729
Purchase Details
Closed on
Dec 12, 1994
Sold by
First National Bank Of Evergreen Park
Bought by
Kapala John M and Kapala Jodi L
Home Financials for this Owner
Home Financials are based on the most recent Mortgage that was taken out on this home.
Original Mortgage
$101,650
Interest Rate
7.12%
Purchase Details
Closed on
Feb 4, 1994
Sold by
Calas Steve G and Calas Bonni J
Bought by
Gibson James A and Gibson Elena G
Home Financials for this Owner
Home Financials are based on the most recent Mortgage that was taken out on this home.
Original Mortgage
$58,000
Interest Rate
7.31%
Create a Home Valuation Report for This Property
The Home Valuation Report is an in-depth analysis detailing your home's value as well as a comparison with similar homes in the area
Home Values in the Area
Average Home Value in this Area
Purchase History
| Date | Buyer | Sale Price | Title Company |
|---|---|---|---|
| Rayburn Johnny D | $118,000 | -- | |
| Kapala John M | $107,000 | Attorneys Title Guaranty Fun | |
| Gibson James A | $38,666 | -- |
Source: Public Records
Mortgage History
| Date | Status | Borrower | Loan Amount |
|---|---|---|---|
| Open | Rayburn Johnny D | $94,400 | |
| Previous Owner | Kapala John M | $101,650 | |
| Previous Owner | Gibson James A | $58,000 |
Source: Public Records
Tax History Compared to Growth
Tax History
| Year | Tax Paid | Tax Assessment Tax Assessment Total Assessment is a certain percentage of the fair market value that is determined by local assessors to be the total taxable value of land and additions on the property. | Land | Improvement |
|---|---|---|---|---|
| 2024 | $3,580 | $20,000 | $2,860 | $17,140 |
| 2023 | $2,241 | $20,000 | $2,860 | $17,140 |
| 2022 | $2,241 | $13,446 | $2,431 | $11,015 |
| 2021 | $2,169 | $13,446 | $2,431 | $11,015 |
| 2020 | $2,186 | $13,446 | $2,431 | $11,015 |
| 2019 | $2,322 | $14,677 | $2,145 | $12,532 |
| 2018 | $2,230 | $14,677 | $2,145 | $12,532 |
| 2017 | $2,177 | $14,677 | $2,145 | $12,532 |
| 2016 | $2,223 | $12,606 | $2,002 | $10,604 |
| 2015 | $2,141 | $12,606 | $2,002 | $10,604 |
| 2014 | $2,134 | $12,606 | $2,002 | $10,604 |
| 2013 | $2,294 | $13,862 | $2,002 | $11,860 |
Source: Public Records
Map
Nearby Homes
- 16101 Haven Ave
- 8735 Golden Rose Dr
- 15826 Orlan Brook Dr Unit 3S
- 9291 Erin Ln Unit D7
- 16231 92nd Ave
- 15726 Orlan Brook Dr Unit 193
- 9215 Fox Ct
- 8824 Carnoustie Dr
- 15713 Orlan Brook Dr Unit 98
- 9209 Cliffside Ln Unit 54C
- 15717 Orlan Brook Dr Unit G83
- 15712 86th Ave Unit 117
- 16121 S 94th Ave
- 9298 Meadowview Dr Unit 9298
- 8534 Westberry Ln Unit 8534
- 15511 Westminster Dr Unit 65B
- 9411 Albany Ct
- 15633 Orlan Brook Dr
- 9430 Georgetown Square
- 9170 Wheeler Dr
- 15916 Haven Ave
- 15900 Haven Ave
- 15932 Haven Ave
- 15909 Haven Ave
- 15917 Haven Ave
- 15903 Haven Ave
- 15940 Haven Ave
- 15933 Haven Ave
- 15948 Haven Ave
- 15941 Haven Ave
- 15956 Haven Ave
- 15939 Haven Ave
- 8927 W 159th St
- 8921 W 159th St
- 15945 Haven Ave
- 15960 Haven Ave
- 15965 Haven Ave
- 15972 Haven Ave
- 15955 90th Ave