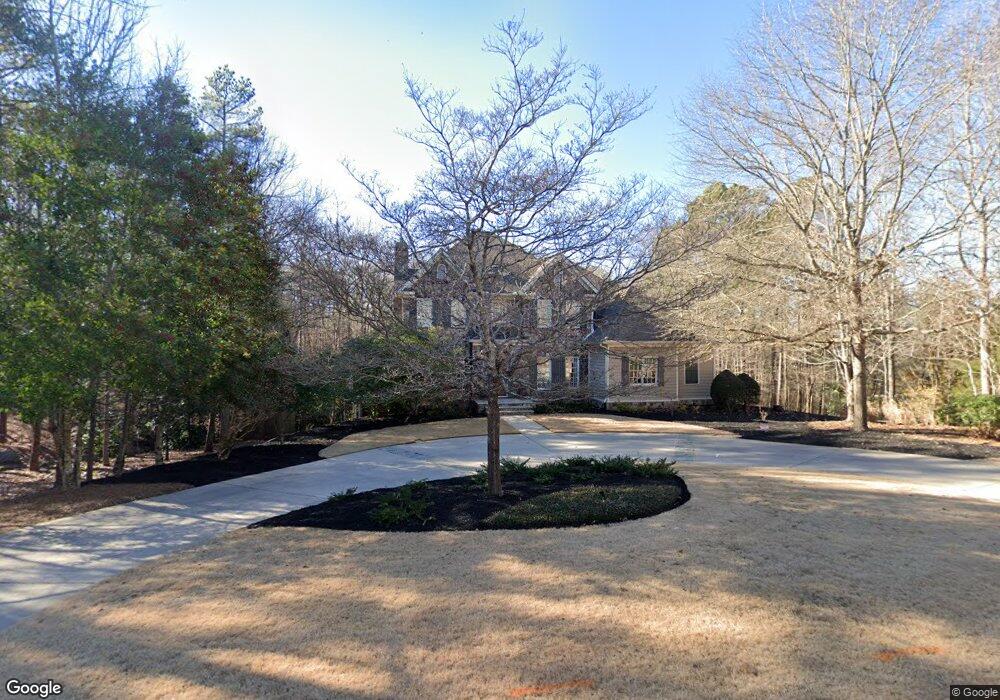
1591 Tanglebrook Dr Athens, GA 30606
Skyline NeighborhoodEstimated Value: $918,000 - $1,187,692
Studio
--
Bath
4,564
Sq Ft
$226/Sq Ft
Est. Value
About This Home
This home is located at 1591 Tanglebrook Dr, Athens, GA 30606 and is currently estimated at $1,033,564, approximately $226 per square foot. 1591 Tanglebrook Dr is a home located in Oconee County with nearby schools including Oconee County Primary School, Oconee County Elementary School, and Malcom Bridge Middle School.
Ownership History
Date
Name
Owned For
Owner Type
Purchase Details
Closed on
Mar 14, 2005
Sold by
Pittman Susan S
Bought by
Pittman Clyde E
Current Estimated Value
Purchase Details
Closed on
Feb 23, 2005
Sold by
Pittman Clyde E
Bought by
Pittman Susan S
Purchase Details
Closed on
Feb 13, 2004
Sold by
Johnson Charlotte D
Bought by
Pittman Clyde E
Purchase Details
Closed on
Feb 10, 2004
Sold by
Omni National Bank
Bought by
Johnson Charlotte D
Purchase Details
Closed on
Aug 7, 2003
Sold by
Johnson Charlotte D
Bought by
Crowell Steven M
Purchase Details
Closed on
Jun 6, 2002
Sold by
Johnson Charlotte D
Bought by
Johnson Charlotte D
Create a Home Valuation Report for This Property
The Home Valuation Report is an in-depth analysis detailing your home's value as well as a comparison with similar homes in the area
Home Values in the Area
Average Home Value in this Area
Purchase History
| Date | Buyer | Sale Price | Title Company |
|---|---|---|---|
| Pittman Clyde E | -- | -- | |
| Pittman Susan S | -- | -- | |
| Pittman Clyde E | $792,900 | -- | |
| Johnson Charlotte D | -- | -- | |
| Crowell Steven M | $647,000 | -- | |
| Johnson Charlotte D | -- | -- | |
| Johnson Charlotte D | $82,000 | -- |
Source: Public Records
Tax History
| Year | Tax Paid | Tax Assessment Tax Assessment Total Assessment is a certain percentage of the fair market value that is determined by local assessors to be the total taxable value of land and additions on the property. | Land | Improvement |
|---|---|---|---|---|
| 2025 | $7,680 | $454,852 | $40,000 | $414,852 |
| 2024 | $7,680 | $436,521 | $59,400 | $377,121 |
| 2023 | $8,181 | $416,460 | $56,496 | $359,964 |
| 2022 | $8,079 | $375,673 | $56,496 | $319,177 |
| 2021 | $8,094 | $348,961 | $56,496 | $292,465 |
| 2020 | $7,969 | $342,998 | $56,496 | $286,502 |
| 2019 | $7,658 | $329,590 | $56,496 | $273,094 |
| 2018 | $7,760 | $326,988 | $56,496 | $270,492 |
| 2017 | $7,760 | $326,988 | $56,496 | $270,492 |
| 2016 | $7,740 | $326,141 | $56,496 | $269,645 |
| 2015 | $8,482 | $356,818 | $56,496 | $300,322 |
| 2014 | $7,781 | $319,948 | $56,496 | $263,452 |
| 2013 | -- | $341,999 | $63,558 | $278,441 |
Source: Public Records
Map
Nearby Homes
- 155 Ridgeview Dr
- 1340 Old Epps Bridge Rd
- 157 Holly Hills Ct
- 199 Lenox Place
- 301 Skyline Pkwy
- 190 Kirkwood Dr
- 1141 Beverly Dr
- 1705 Timothy Rd
- 200 Skyline Pkwy
- 137 Timothy Park Ln
- 173 Timothy Park Ln
- 780 Kings Rd
- 199 Tanglewood Dr
- 220 Tanglewood Dr
- 215 Lenox Rd
- 160 Edgewood Dr
- 1270 Nona Dr
- 381 Township Ln
- 1847 Olympus Ct
- 1845 Olympus Ct
- 1620 Tanglebrook Dr
- 1560 Tanglebrook Dr
- 1561 Tanglebrook Dr
- 1540 Tanglebrook Dr
- 1011 Gnarled Oak Ct
- 1020 Gnarled Oak Ct
- 1021 Gnarled Oak Ct
- 1541 Tanglebrook Dr
- 1520 Tanglebrook Dr
- 1450 Tanglebrook Dr
- 1071 Laurel Place
- 1021 Pine Ridge Ct
- 187 McNutts Creek Place
- 1051 Pine Ridge Ct
- 1031 Pine Ridge Ct
- 1061 Laurel Place
- 177 McNutts Creek Place
- 1440 Tanglebrook Dr
- 1480 Tanglebrook Dr
- 197 McNutts Creek Place
Your Personal Tour Guide
Ask me questions while you tour the home.