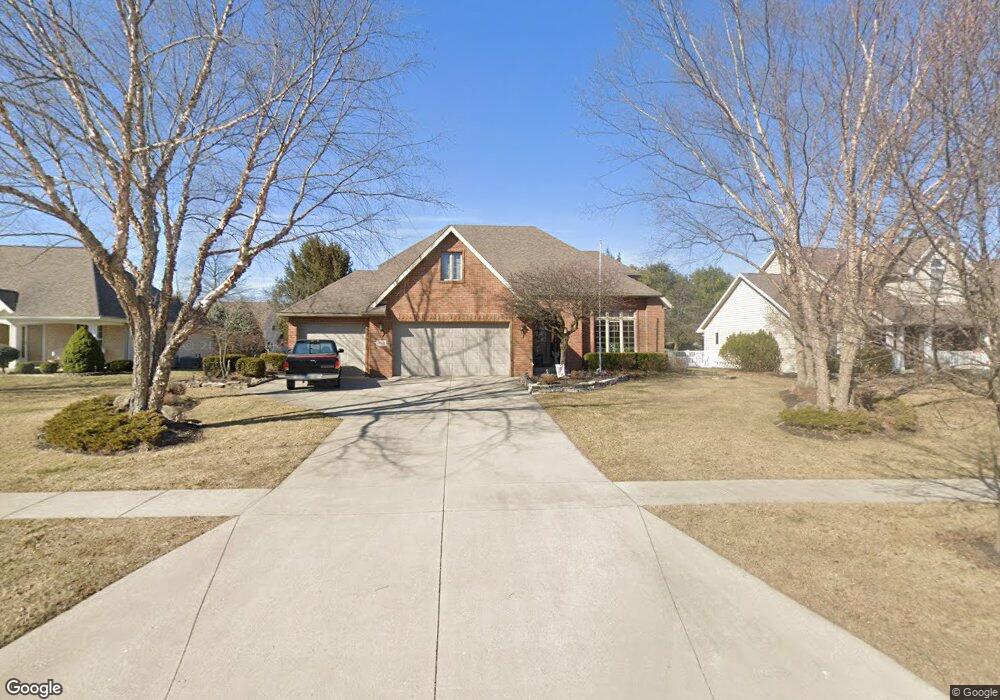
15910 Wolf Run Findlay, OH 45840
Estimated Value: $473,000 - $541,000
4
Beds
3
Baths
3,213
Sq Ft
$158/Sq Ft
Est. Value
About This Home
This home is located at 15910 Wolf Run, Findlay, OH 45840 and is currently estimated at $506,997, approximately $157 per square foot. 15910 Wolf Run is a home located in Hancock County with nearby schools including Wilson Vance Elementary School, Whittier Elementary School, and Glenwood Middle School.
Ownership History
Date
Name
Owned For
Owner Type
Purchase Details
Closed on
Sep 25, 2017
Sold by
Amburgey Jimmy and Amburgey Carolyn A
Bought by
Amburgey Jimmy D and Amburgey Carolyn A
Current Estimated Value
Purchase Details
Closed on
Feb 2, 2011
Sold by
Fannie Mae
Bought by
Amburgey Jimmy and Amburgey Carolyn A
Home Financials for this Owner
Home Financials are based on the most recent Mortgage that was taken out on this home.
Original Mortgage
$160,000
Interest Rate
4.81%
Mortgage Type
New Conventional
Purchase Details
Closed on
Apr 23, 2010
Sold by
Larson Kay A
Bought by
Federal National Mortgage Association
Purchase Details
Closed on
Feb 10, 2003
Sold by
Miyake Itsuo
Bought by
Larson Kay A
Home Financials for this Owner
Home Financials are based on the most recent Mortgage that was taken out on this home.
Original Mortgage
$224,800
Interest Rate
6.01%
Mortgage Type
New Conventional
Create a Home Valuation Report for This Property
The Home Valuation Report is an in-depth analysis detailing your home's value as well as a comparison with similar homes in the area
Home Values in the Area
Average Home Value in this Area
Purchase History
| Date | Buyer | Sale Price | Title Company |
|---|---|---|---|
| Amburgey Jimmy D | -- | None Available | |
| Amburgey Jimmy | $239,900 | Mid Am Title Agency | |
| Federal National Mortgage Association | $191,000 | None Available | |
| Larson Kay A | $281,000 | -- |
Source: Public Records
Mortgage History
| Date | Status | Borrower | Loan Amount |
|---|---|---|---|
| Previous Owner | Amburgey Jimmy | $160,000 | |
| Previous Owner | Larson Kay A | $224,800 |
Source: Public Records
Tax History Compared to Growth
Tax History
| Year | Tax Paid | Tax Assessment Tax Assessment Total Assessment is a certain percentage of the fair market value that is determined by local assessors to be the total taxable value of land and additions on the property. | Land | Improvement |
|---|---|---|---|---|
| 2024 | $4,349 | $131,800 | $22,490 | $109,310 |
| 2023 | $4,378 | $131,800 | $22,490 | $109,310 |
| 2022 | $4,378 | $131,800 | $22,490 | $109,310 |
| 2021 | $4,405 | $116,300 | $12,850 | $103,450 |
| 2020 | $4,404 | $116,300 | $12,850 | $103,450 |
| 2019 | $4,316 | $116,300 | $12,850 | $103,450 |
| 2018 | $4,034 | $100,750 | $10,710 | $90,040 |
| 2017 | $2,018 | $100,750 | $10,710 | $90,040 |
| 2016 | $3,961 | $100,750 | $10,710 | $90,040 |
| 2015 | $4,086 | $101,350 | $11,310 | $90,040 |
| 2014 | $3,994 | $101,350 | $11,310 | $90,040 |
| 2012 | $4,562 | $105,100 | $11,310 | $93,790 |
Source: Public Records
Map
Nearby Homes
- 8130 Shawnee Forest Dr
- 8100 Shawnee Forest Dr
- 0 Forest Ln Unit Lot 258
- 16078 Forest Lake Dr
- 8405 Indian Lake Dr
- 8499 Indian Lake Dr
- 0 Lakeside Dr
- 8419 E Woodland Trail
- 0 Hickory Ln Unit 1 307878
- 0 Hickory Ln Unit 20252999
- 0 Hickory Ln Unit 1
- 7752 E Point Dr
- 7665 Brookstone Dr
- 7507 Township Road 212
- 7711 E Watermark Dr
- 0 E Us Route 224
- 15329 E Us Route 224
- 0 Meadowview Dr
- 267 Sierra Ct
- 7137 Township Road 212
- 15886 Wolf Run
- 15924 Wolf Run
- 15915 Forest Lake Dr
- 15932 Wolf Run
- 15925 Forest Lake Dr
- 15870 Wolf Run
- 15885 Forest Lake Dr
- 15911 Wolf Run
- 15935 Forest Lake Dr
- 15885 Wolf Run
- 15925 Wolf Run
- 15871 Forest Lake Dr
- 15940 Wolf Run
- 15871 Wolf Run
- 15931 Wolf Run
- 15859 Forest Lake Dr
- 15945 Forest Lake Dr
- 15939 Wolf Run
- 15857 Wolf Run
- 15946 Wolf Run