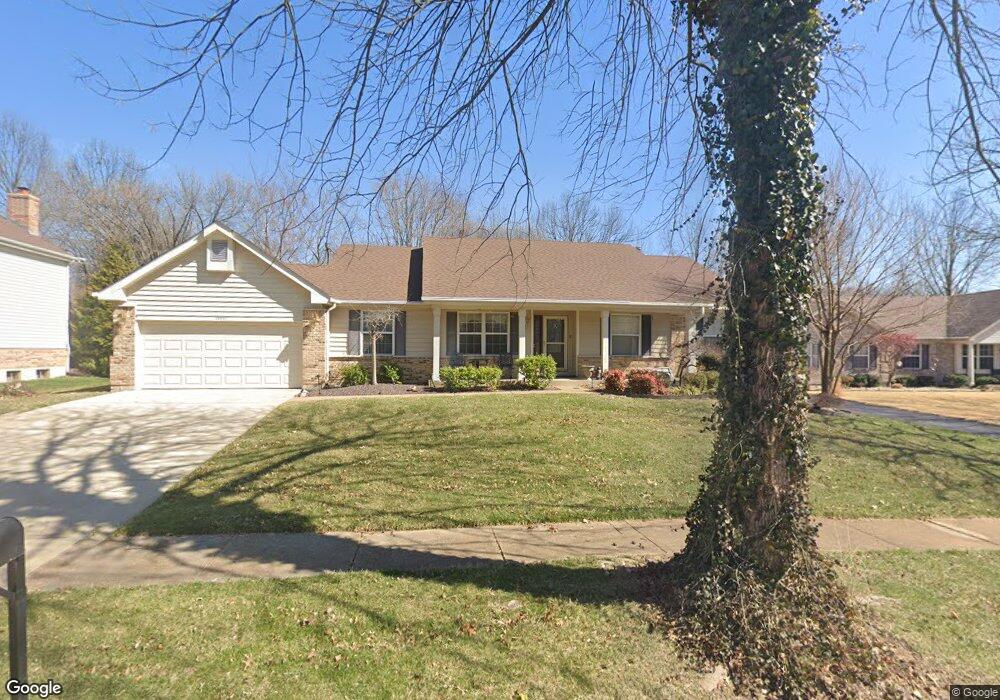
15911 Cypress Trace Ct Chesterfield, MO 63017
Estimated Value: $481,000 - $564,000
3
Beds
3
Baths
2,082
Sq Ft
$244/Sq Ft
Est. Value
About This Home
This home is located at 15911 Cypress Trace Ct, Chesterfield, MO 63017 and is currently estimated at $507,941, approximately $243 per square foot. 15911 Cypress Trace Ct is a home located in St. Louis County with nearby schools including Kehrs Mill Elementary, Crestview Middle School, and Marquette Sr. High School.
Ownership History
Date
Name
Owned For
Owner Type
Purchase Details
Closed on
Jan 26, 2022
Sold by
Phelan Victoria L
Bought by
Victoria Phelan Revocable Living Trust
Current Estimated Value
Purchase Details
Closed on
Mar 16, 2009
Sold by
Eisenberger Paul H and Eisenberger Martha L
Bought by
Phelan Thomas E and Phelan Victoria L
Purchase Details
Closed on
May 18, 2006
Sold by
Ault Richard J and Ault Jacqueline
Bought by
Eisenberger Paul H and Eisenberger Martha L
Home Financials for this Owner
Home Financials are based on the most recent Mortgage that was taken out on this home.
Original Mortgage
$53,400
Interest Rate
6.06%
Mortgage Type
Fannie Mae Freddie Mac
Purchase Details
Closed on
Jun 25, 1999
Sold by
Hogan Michael V
Bought by
Ault Richard J and Ault Jacqueline
Home Financials for this Owner
Home Financials are based on the most recent Mortgage that was taken out on this home.
Original Mortgage
$174,800
Interest Rate
7.21%
Create a Home Valuation Report for This Property
The Home Valuation Report is an in-depth analysis detailing your home's value as well as a comparison with similar homes in the area
Home Values in the Area
Average Home Value in this Area
Purchase History
| Date | Buyer | Sale Price | Title Company |
|---|---|---|---|
| Victoria Phelan Revocable Living Trust | -- | None Listed On Document | |
| Phelan Thomas E | $365,000 | None Available | |
| Eisenberger Paul H | $356,000 | None Available | |
| Ault Richard J | $218,500 | -- |
Source: Public Records
Mortgage History
| Date | Status | Borrower | Loan Amount |
|---|---|---|---|
| Previous Owner | Eisenberger Paul H | $53,400 | |
| Previous Owner | Eisenberger Paul H | $284,800 | |
| Previous Owner | Ault Richard J | $174,800 |
Source: Public Records
Tax History Compared to Growth
Tax History
| Year | Tax Paid | Tax Assessment Tax Assessment Total Assessment is a certain percentage of the fair market value that is determined by local assessors to be the total taxable value of land and additions on the property. | Land | Improvement |
|---|---|---|---|---|
| 2025 | $5,467 | $86,920 | $28,650 | $58,270 |
| 2024 | $5,467 | $78,220 | $21,490 | $56,730 |
| 2023 | $5,463 | $78,220 | $21,490 | $56,730 |
| 2022 | $5,122 | $68,100 | $21,490 | $46,610 |
| 2021 | $5,085 | $68,100 | $21,490 | $46,610 |
| 2020 | $4,883 | $62,340 | $21,490 | $40,850 |
| 2019 | $4,902 | $62,340 | $21,490 | $40,850 |
| 2018 | $5,032 | $60,350 | $17,900 | $42,450 |
| 2017 | $4,913 | $60,350 | $17,900 | $42,450 |
| 2016 | $4,534 | $53,540 | $13,430 | $40,110 |
| 2015 | $4,442 | $53,540 | $13,430 | $40,110 |
| 2014 | $4,142 | $48,660 | $9,980 | $38,680 |
Source: Public Records
Map
Nearby Homes
- 9 Picardy Hill Dr
- 15921 Picardy Crest Ct
- 15740 Tambour Ct
- 925 Camargo Dr
- 1020 Del Ebro Dr
- 155 Forest Club Dr
- 10 Forest Club Dr
- 2259 Sycamore Dr
- 927 Claytonbrook Dr Unit 3
- 917 Claytonbrook Dr Unit 3
- 920 Claytonbrook Dr Unit 3
- 922 Claytonbrook Dr Unit 2
- 910 Claytonbrook Dr Unit 1
- 16078 Meadow Oak Dr
- 15575 Meadowbrook Circle Ln
- 233 Whiting Ln
- 2300 Sterling Pointe Dr
- 1131 Claytonbrook Ct Unit 1131
- 259 Meadowbrook Country Club Estate
- 312 Clayton Crossing Dr Unit 304
- 15917 Cypress Trace Ct
- 15907 Cypress Trace Ct
- 15925 Eagles Landing Ct
- 15931 Eagles Landing Ct
- 15912 Cypress Trace Ct
- 15919 Eagles Landing Ct
- 15937 Eagles Landing Ct
- 15901 Cypress Trace Ct
- 15923 Cypress Trace Ct
- 15906 Cypress Trace Ct
- 15918 Cypress Trace Ct
- 15900 Cypress Trace Ct
- 15943 Eagles Landing Ct
- 15924 Cypress Trace Ct
- 15913 Eagles Landing Ct
- 15930 Eagles Landing Ct
- 15927 Cypress Trace Ct
- 15924 Eagles Landing Ct
- 2370 Westpar Dr
- 2338 Westpar Dr